Bitcoin’s impressive rally shows signs of fatigue, as technical indicators warn of a potential pullback toward the $100,000 support level, even though the long-term trend remains bullish.
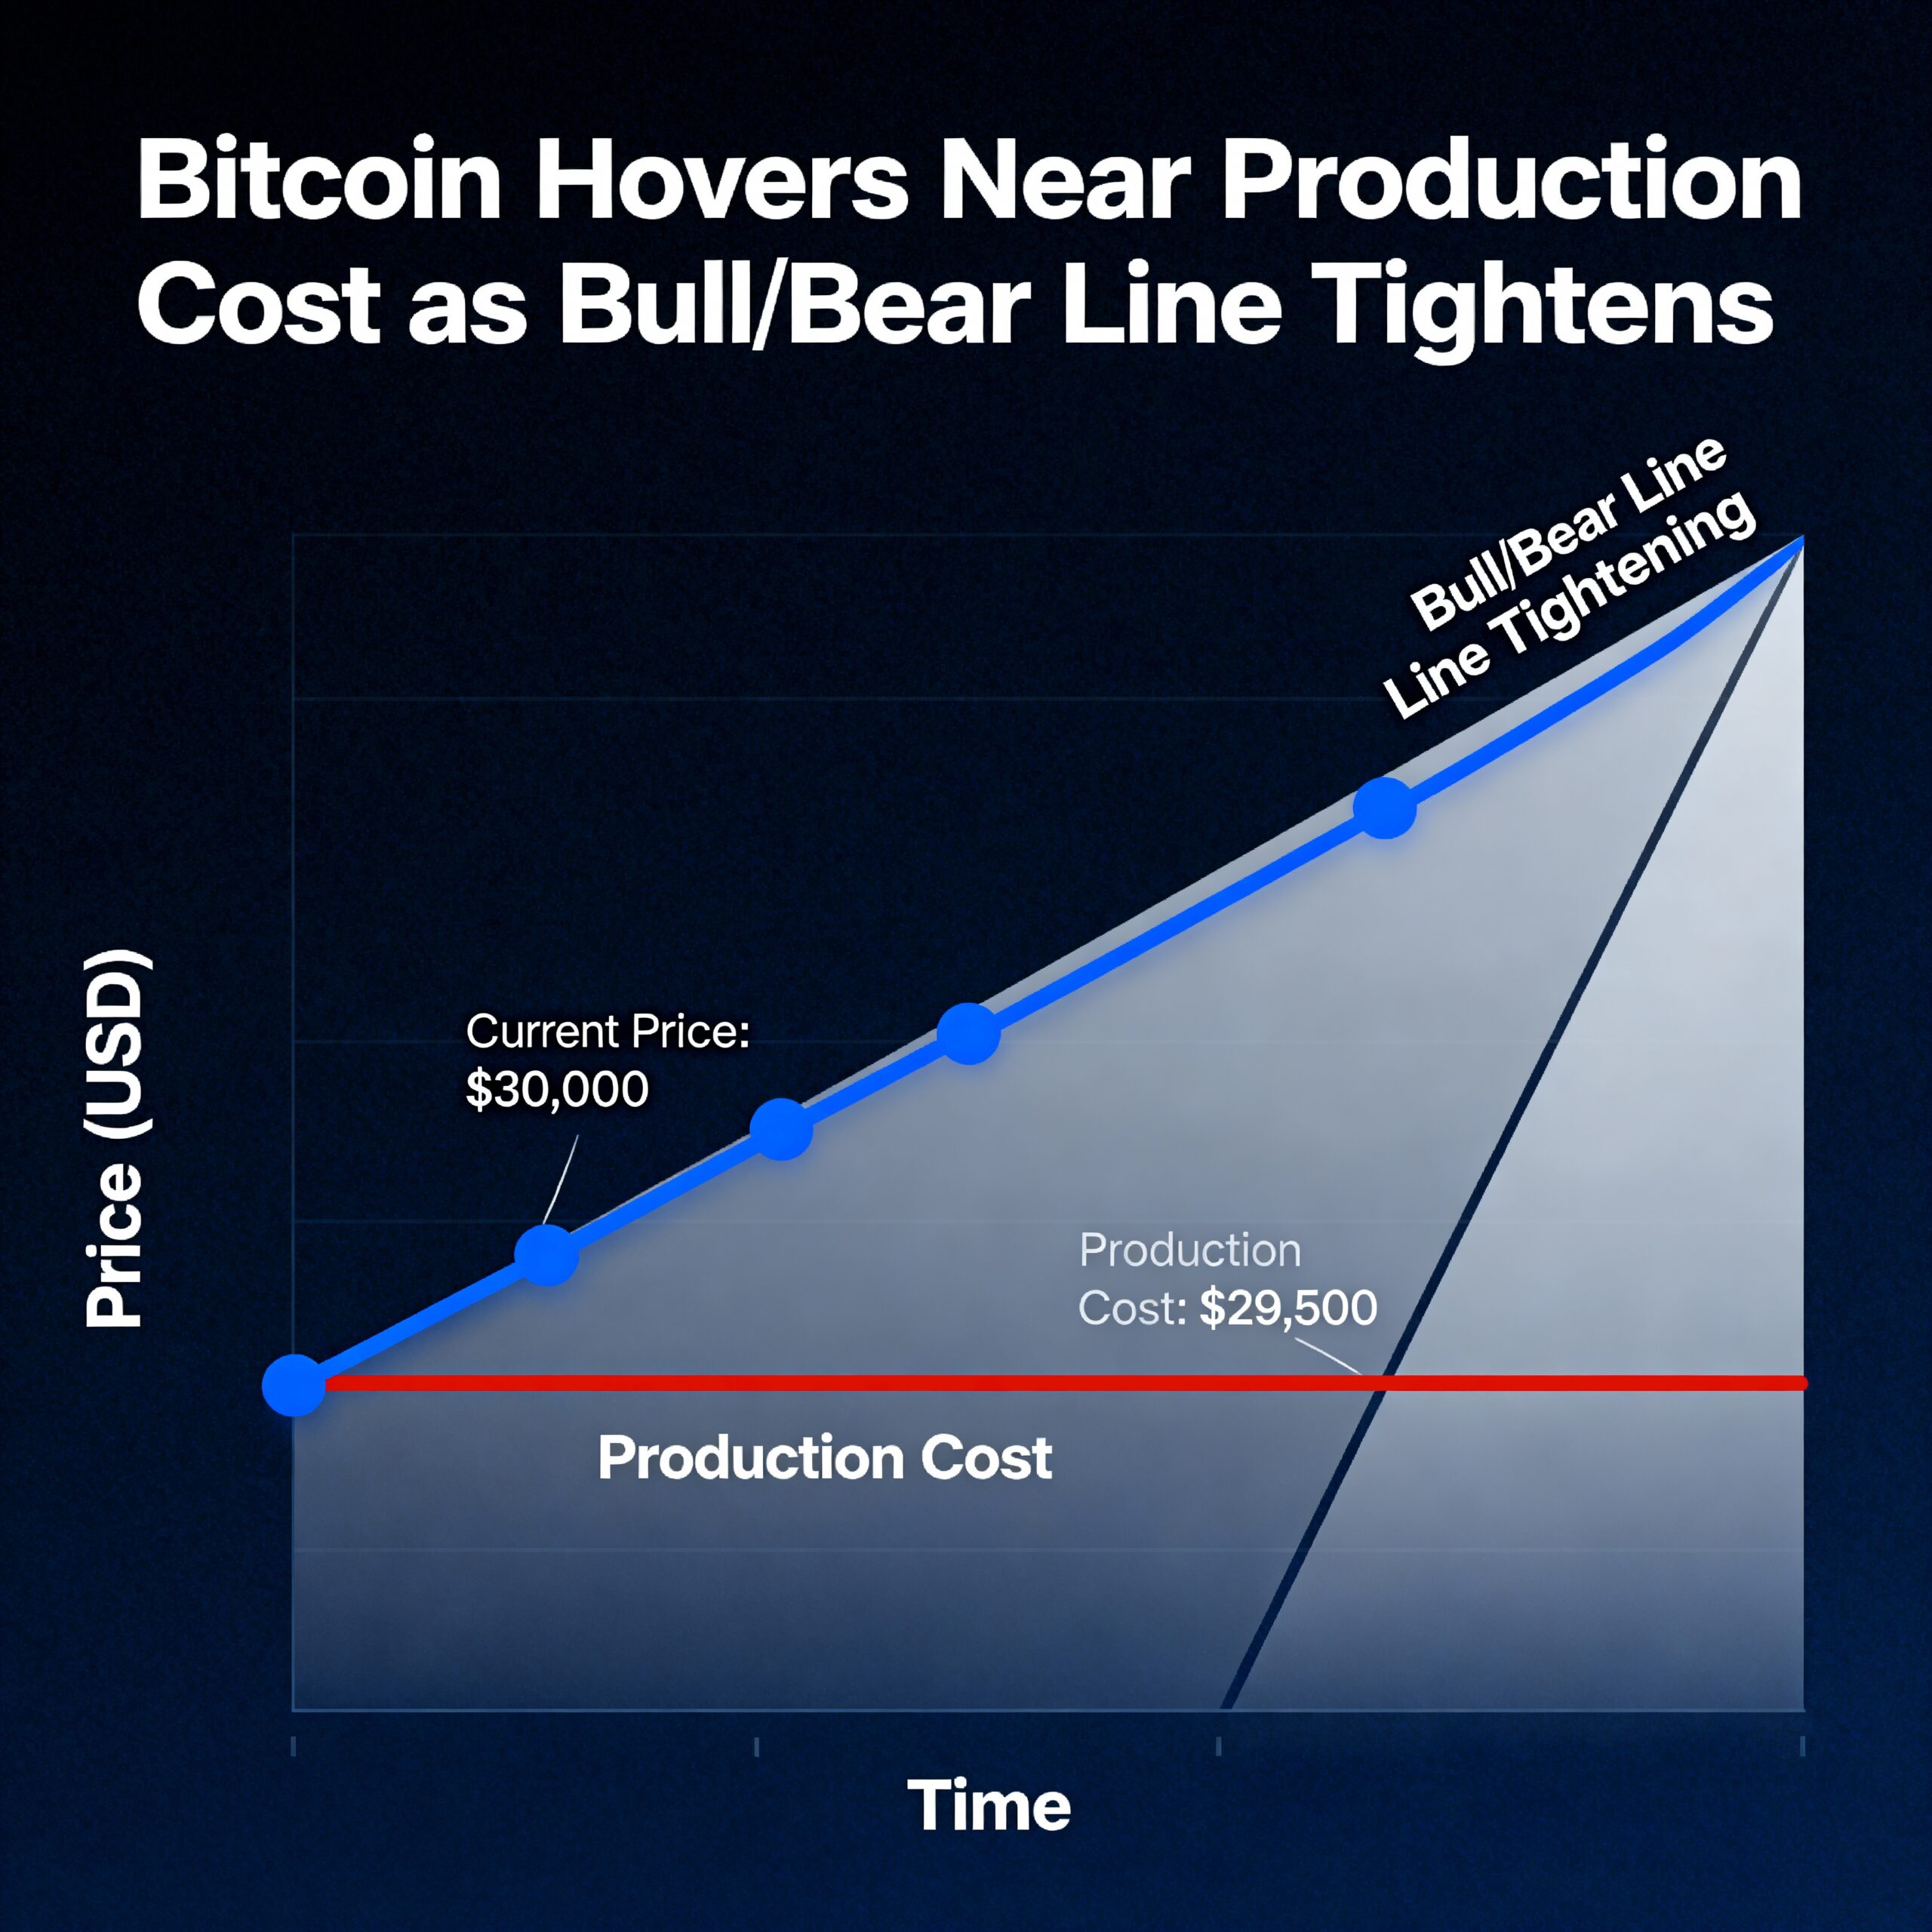
Currently trading near $108,000, Bitcoin (BTC) appears to be testing the lower edge of its established upward channel—the price corridor that carried it from $75,000 to all-time highs just above $110,000, according to TradingView.
Despite announcements of a $3 billion crypto buying initiative by a Trump family media company, buying pressure has waned over the past day, suggesting traders may be taking profits or adopting a cautious stance.
Key momentum readings are flashing caution. The 30-day rate of change (ROC), which measures Bitcoin’s month-over-month price performance, is displaying bearish divergence: while price continues to climb, the ROC is failing to confirm this strength by making lower highs. This divergence often precedes downward corrections.
Moreover, the daily MACD histogram—a tool used to assess trend momentum—has turned negative, adding to the bearish signals.
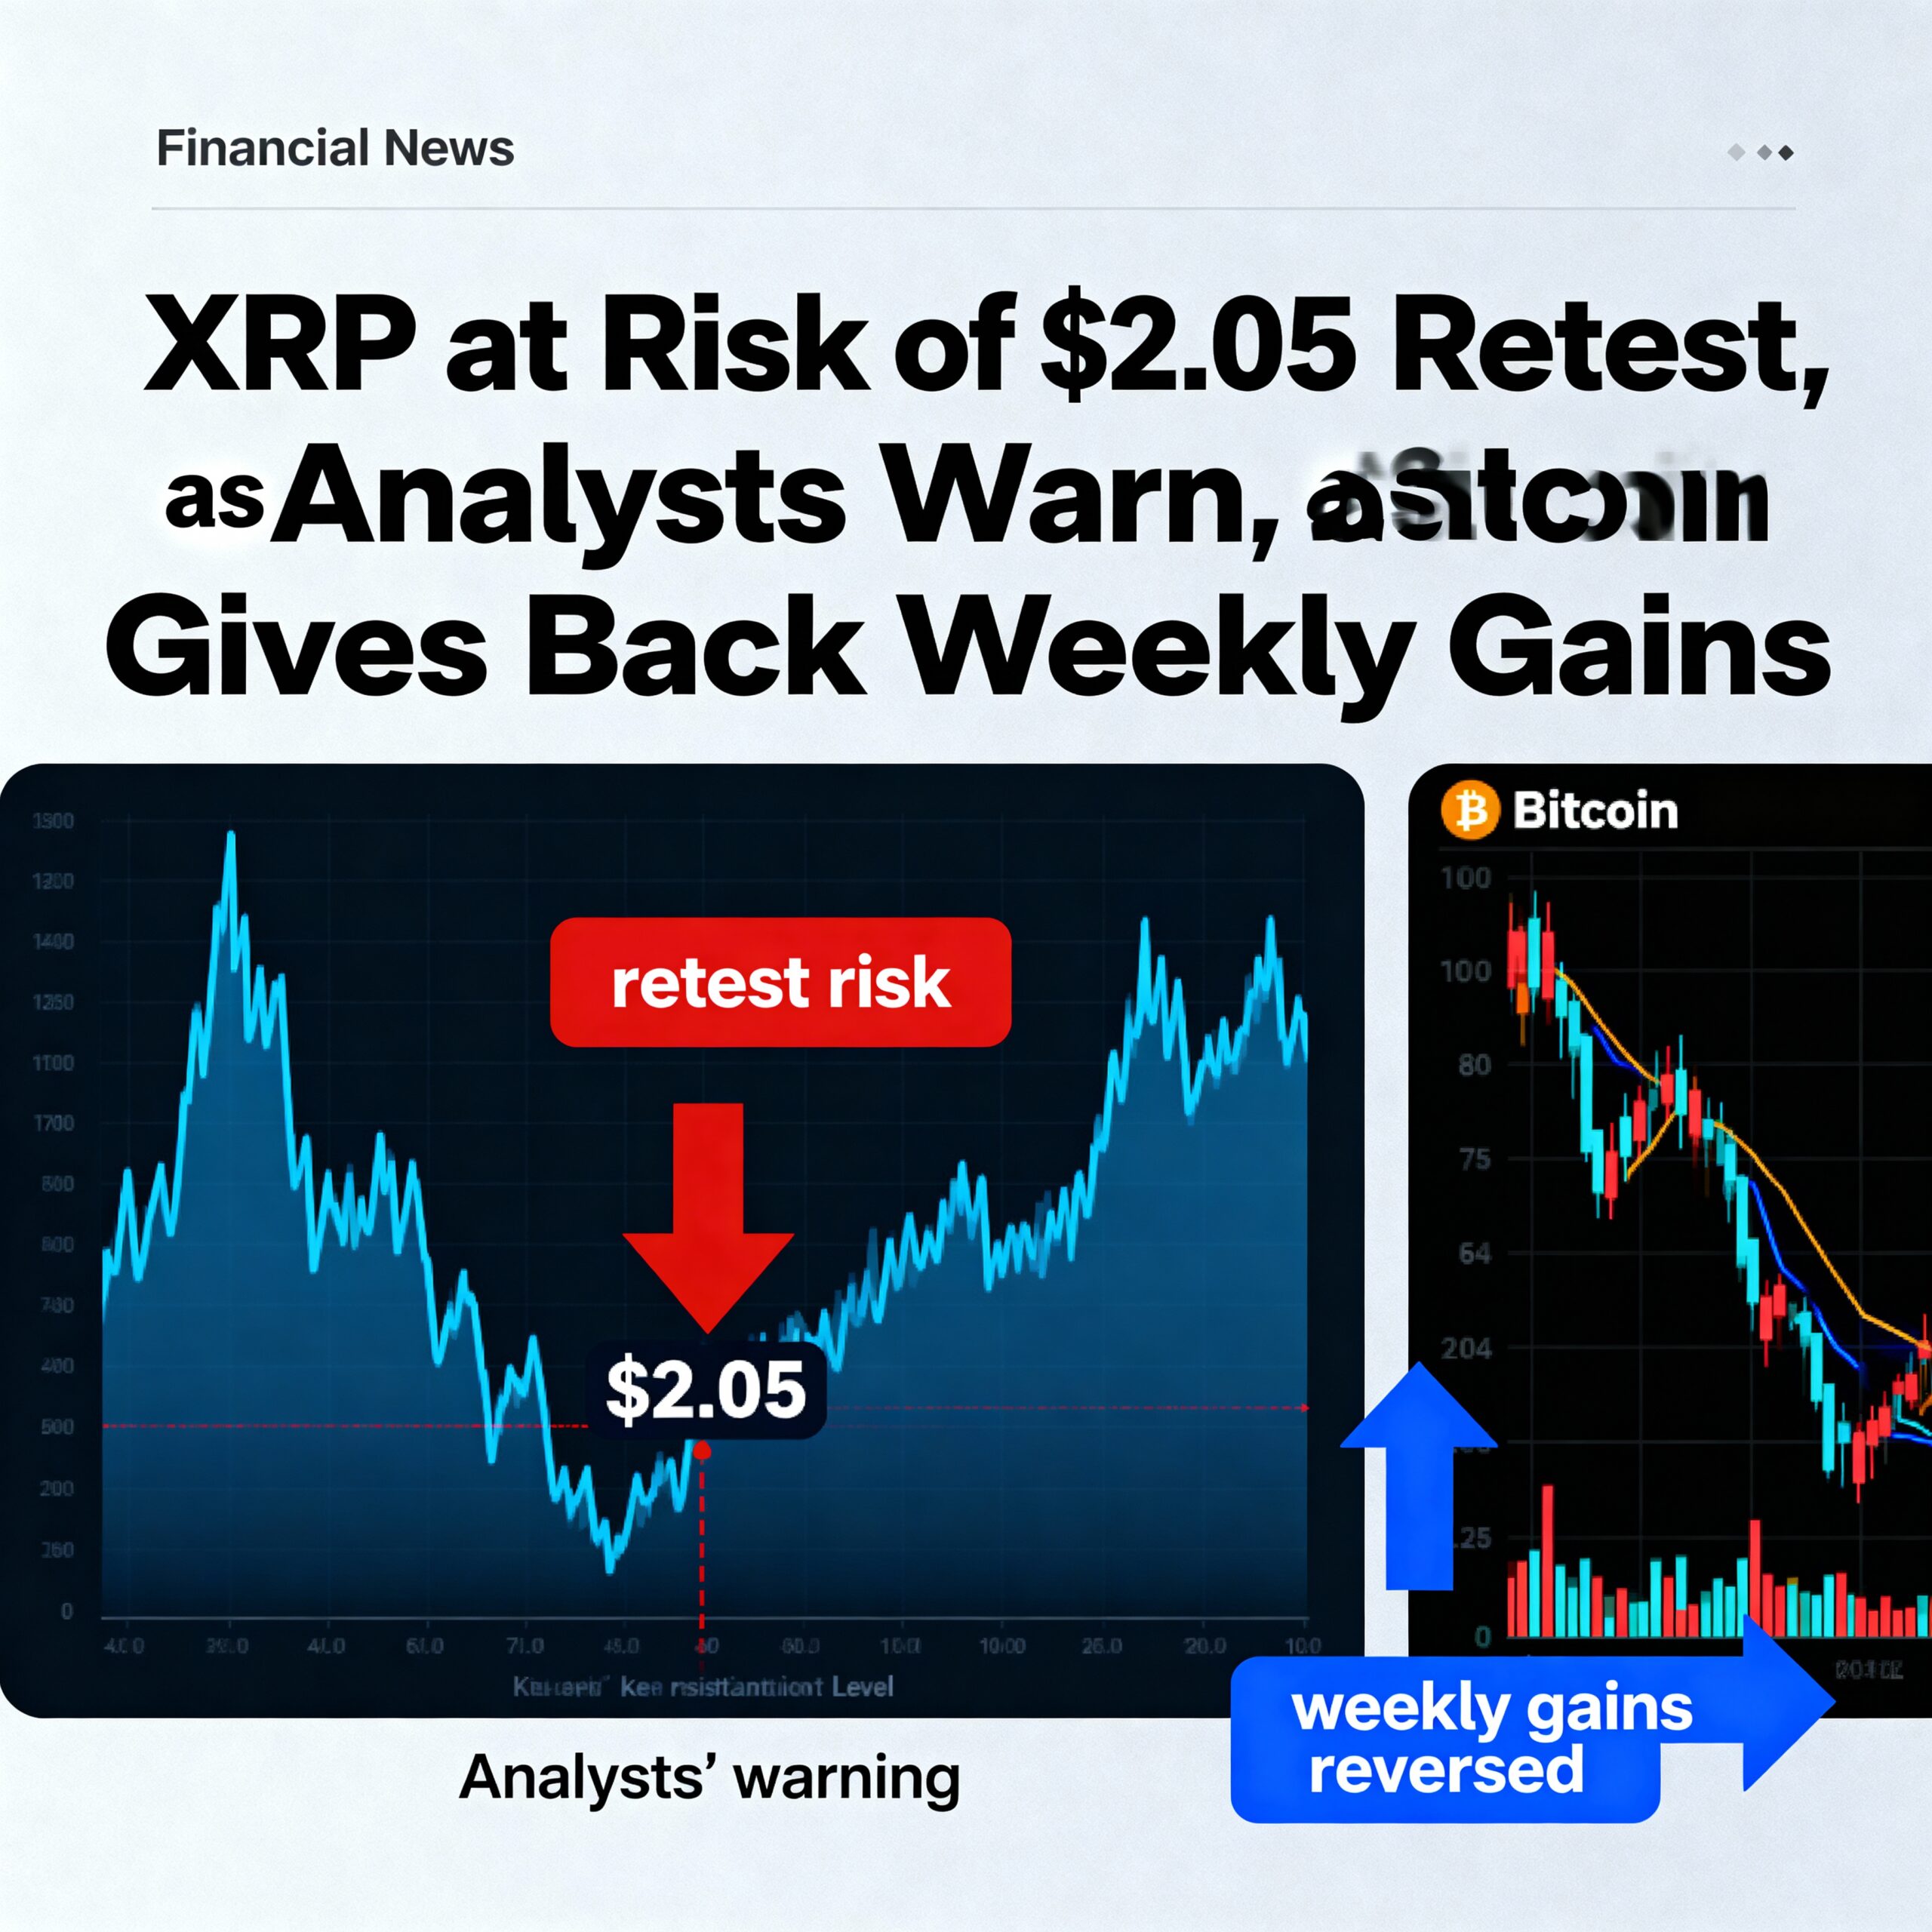
Together, these technical signs suggest Bitcoin could break below its bullish channel and retest the psychologically significant $100,000 mark, a level that previously acted as resistance before turning into support.
Nonetheless, the overall picture remains constructive, bolstered by the recent golden cross crossover of the 50-day and 200-day simple moving averages, indicating that the medium-to-long-term uptrend is still intact.