Solana’s Throwback Pattern Signals Renewed Bullish Momentum for Traders
In the fast-paced world of financial markets, the most lucrative entry points are often fleeting. Solana’s (SOL) recent price action, however, is presenting traders with a second chance to capitalize on a bullish breakout.
Over the past week, SOL has gained more than 7%, climbing to $193 after rebounding from a key support zone. This level aligns with a trendline formed by connecting highs from March and July, paired with another trendline connecting lows from April and August. Together, these lines outlined a descending channel that defined SOL’s trading range between March and October.
In early November, SOL successfully broke out of this channel, marking a bullish reversal. The cryptocurrency surged above $260 before retracing back to the breakout point last week, forming what technical analysts identify as a bullish throwback pattern.
In “Technical Analysis: The Complete Resource for Financial Market Technicians,” Charles D. Kirkpatrick II and Julie R. Dahlquist explain that throwbacks occur when prices break upward from a key resistance level but then retrace to retest the breakout point. These retracements are often viewed as optimal entry points for traders, offering reduced risk and well-defined stop-loss zones.
Understanding the Throwback Psychology
Throwback patterns are deeply tied to behavioral finance, particularly prospect theory, which suggests that traders often lock in profits quickly after a breakout due to risk aversion. This profit-taking behavior causes a temporary pullback, bringing prices back to the breakout level.
At this point, traders who missed the initial breakout see the retracement as a second opportunity to enter long positions. This fresh buying pressure reinforces the breakout level as a new support zone, driving prices higher once again. SOL’s recent rebound from this critical level reflects this dynamic.
If SOL maintains upward momentum, traders who exited prematurely during the initial rally may re-enter the market, adding further strength to the bullish trend. Such cycles often lead to prolonged upward price movements.
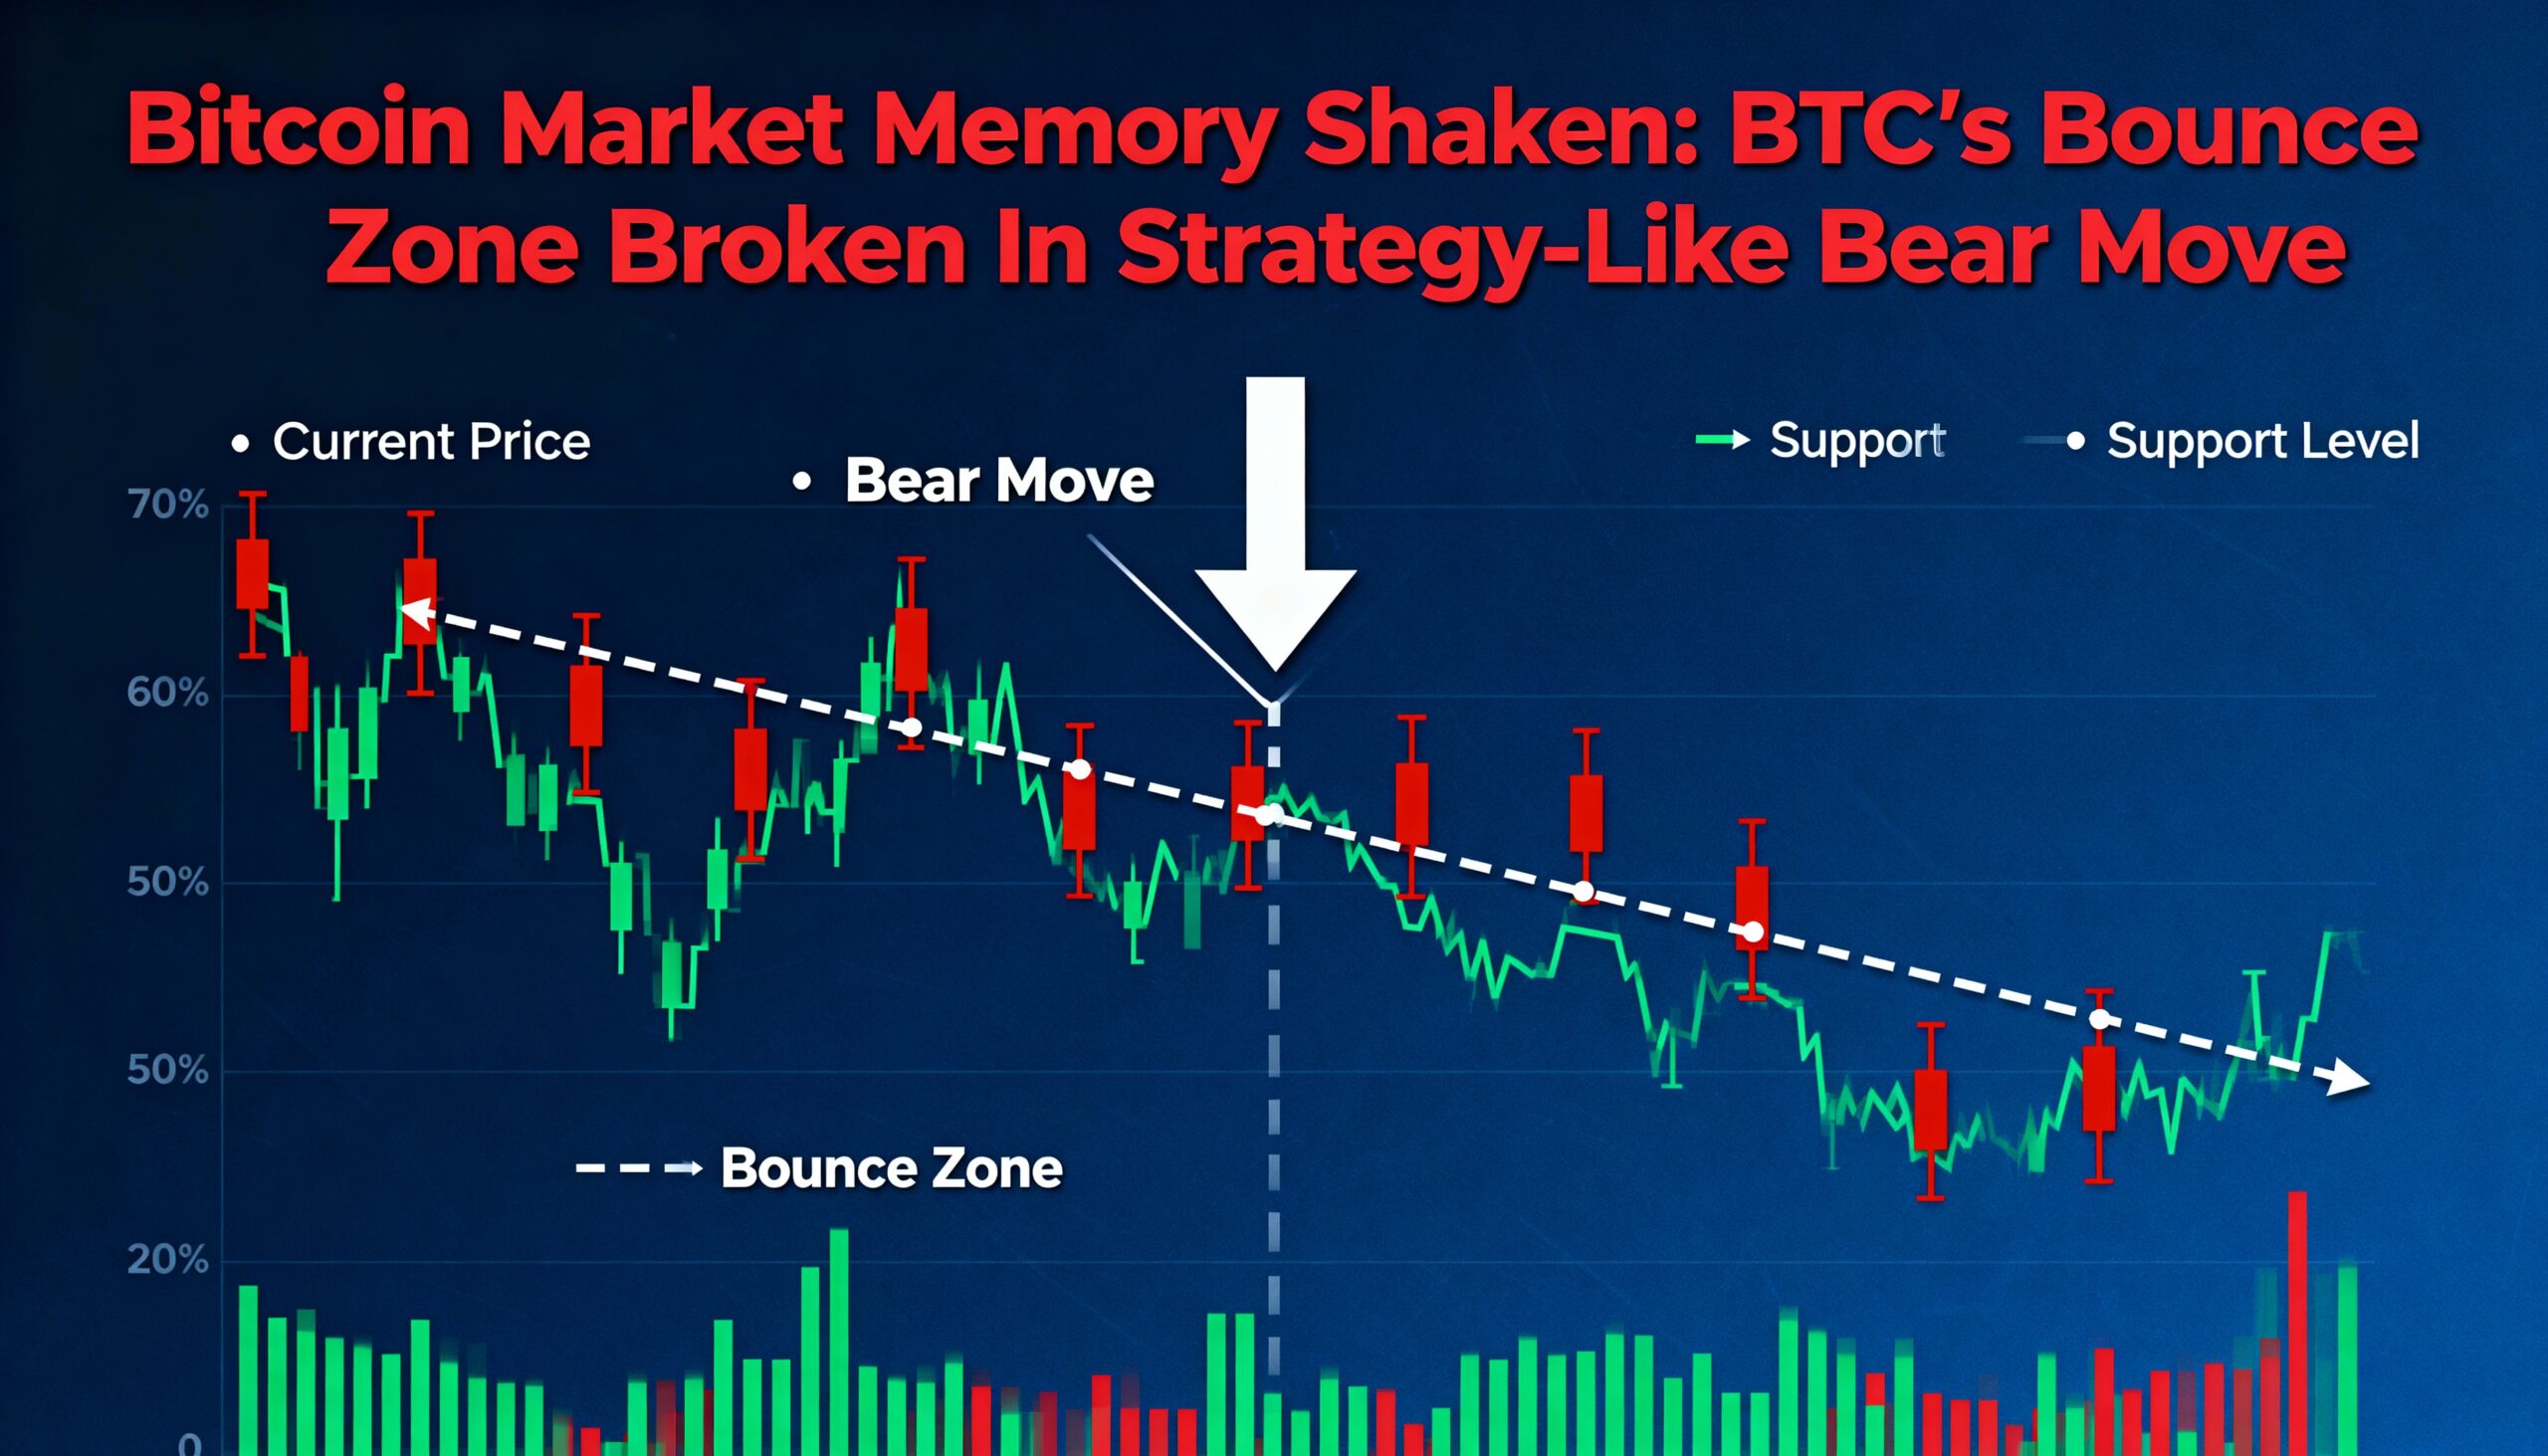
Lessons from Bitcoin’s Previous Pattern
A comparable throwback pattern was observed in Bitcoin (BTC) during the second half of 2023, paving the way for a substantial bull run. However, traders must remain cautious: the bullish setup for SOL will be invalidated if the price fails to sustain its bounce and slips back into the descending channel.
For now, SOL’s price behavior offers a textbook example of a throwback pattern, providing breakout traders with a strategic entry point to ride the next potential rally.