cpeditor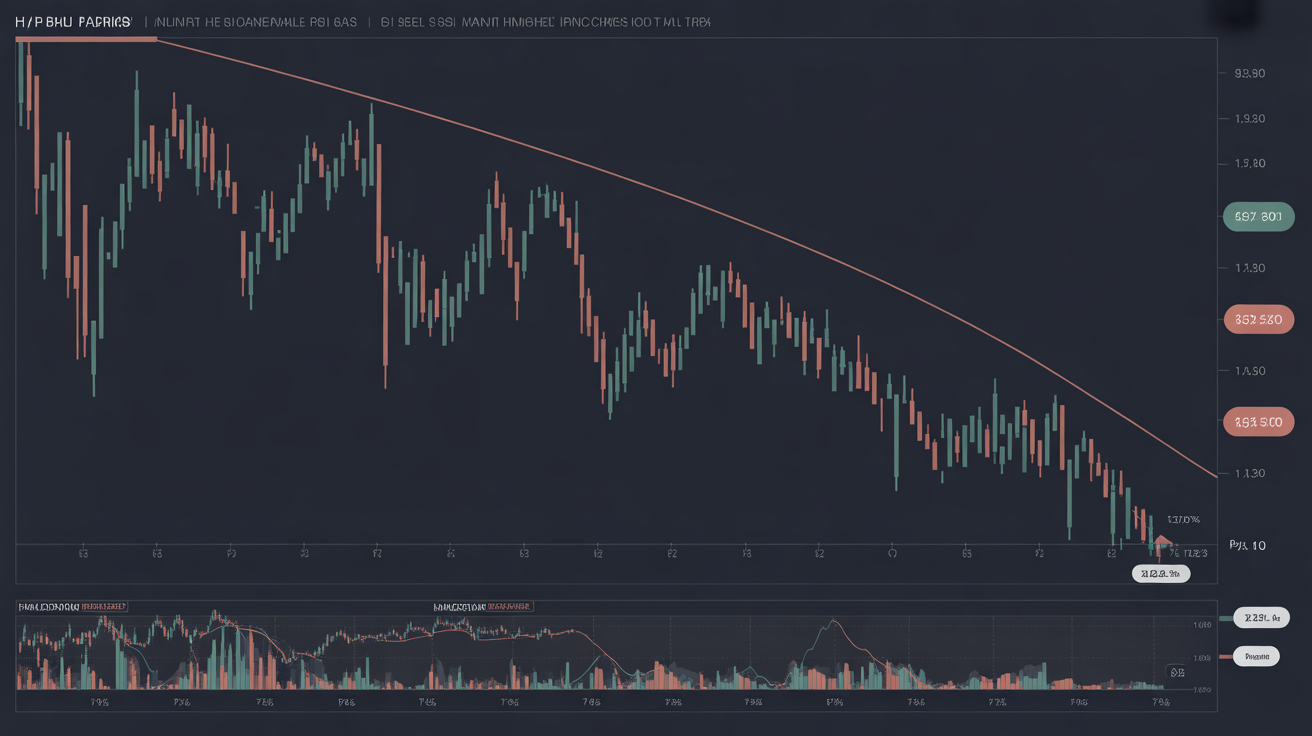
HBAR Slides 1.4% to $0.1675, Breaking Key Support
HBAR’s technical outlook turned firmly bearish after repeated failures to hold above the $0.1700 resistance zone, with a surge in volume confirming a decisive support breakdown.
The token slipped 1.4% on Tuesday, falling from $0.1698 to $0.1675 as bearish momentum intensified. The decline followed a failed attempt to reclaim $0.1700, with sellers pushing HBAR below the key $0.1650 support level. Trading volume spiked 68% above the 24-hour average, reaching 105.45 million tokens around 21:00 UTC, coinciding with the decisive breakdown that cemented bearish control.
Intraday volatility reached 4.9%, with HBAR trading within a $0.0084 range. Short-term data revealed repeated rejections at $0.1690–$0.1697, which now acts as resistance after failed upward attempts. The subsequent drop toward $0.1676 confirms a bearish reversal pattern, signaling weakening market sentiment.
Technical indicators remain the primary driver, as there are limited fundamental catalysts influencing HBAR at present. The inability to recover above $0.1700, combined with volume-backed support breaks, has shifted the structure firmly downward. Traders are watching $0.1690 for potential reversal signals, while sustained weakness below $0.1650 could pave the way toward the next support near $0.1620.
A brief bounce to $0.1675 on thin volume suggests only a technical retracement rather than a meaningful recovery. Without stronger buying pressure, HBAR’s near-term outlook remains biased toward further declines.
Key Technical Levels
Support/Resistance
- Primary resistance: $0.1690–$0.1700 zone after repeated failed breakouts
- Critical support: $0.1650, broken during high-volume move, now acting as resistance
- Secondary support: $0.1620, previously supported by institutional volume absorption
Volume Analysis
- Institutional volume spike: 105.45M tokens, 68% above 24-hour SMA, confirming support breakdown
- Recovery volume: Thin buying interest on the bounce to $0.1675
- Trend: Volume patterns indicate distribution rather than accumulation at current price levels