Bitcoin’s drawn-out stretch of sideways price action is better characterized as structural consolidation than a textbook bearish continuation, even as risks to the downside persist.
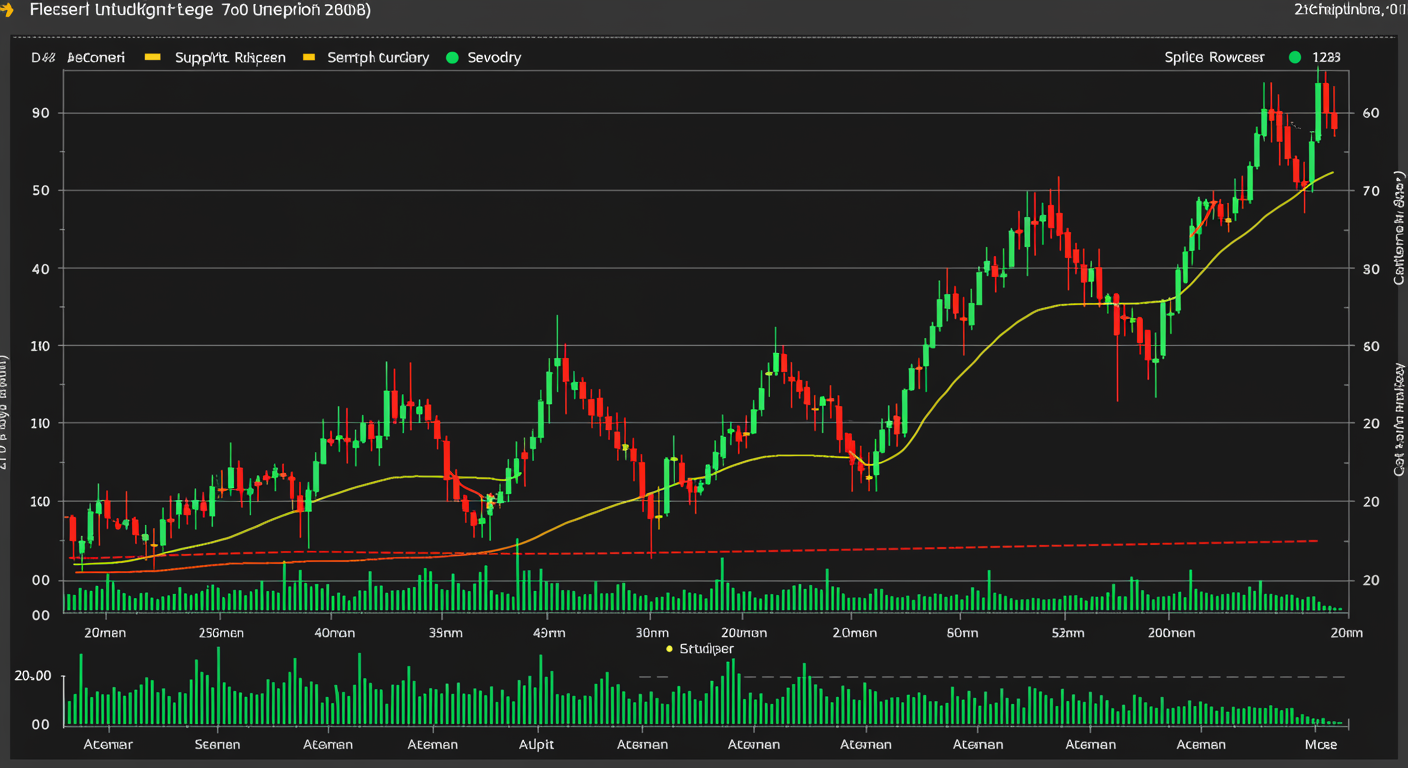
Traders interpreting the nearly 50-day period of choppy movement as a bearish setup may be overlooking the broader context. Since testing levels near $60,000 on Feb. 6, bitcoin has largely traded within a $65,000–$75,000 range, with the market showing signs of exhaustion rather than a clear directional trend.
This phase reflects a market dynamic where time, rather than volatility, is the primary pressure point. The extended consolidation has triggered multiple false breakouts, steadily eroding confidence among both bulls and bears.
Some market participants have labeled the structure a bear flag—a formation typically seen as a short pause within a larger downtrend that often precedes further declines. That interpretation has raised concerns that the correction from October’s record highs could deepen.
However, that comparison appears inconsistent with traditional technical analysis. Bear flags are usually short-lived patterns that resolve within days. Bitcoin’s current range, now approaching 50 days, extends well beyond that typical timeframe.
The prolonged consolidation suggests that sellers are not firmly in control. Instead, the market appears balanced, with neither side able to establish dominance—pointing to indecision rather than a clear bearish continuation.
While this does not rule out the possibility of another move lower—similar to the decline that followed the December–January range—it reframes the current environment as neutral rather than structurally weak.
The broader cycle context also differs from what was seen in 2022. Bitcoin’s rapid rally from $10,000 to $60,000 between late 2020 and early 2021 left limited support zones. When the market reversed, it retraced much of that advance, eventually bottoming near $15,000 during the FTX-driven sell-off.
In contrast, bitcoin spent much of 2024 consolidating between $50,000 and $70,000, effectively building a stronger base within the same region it trades today.
Data shows that more than 600,000 BTC has been accumulated during the current pullback, signaling firm underlying demand and a more durable structural foundation compared to previous cycles.