cpeditor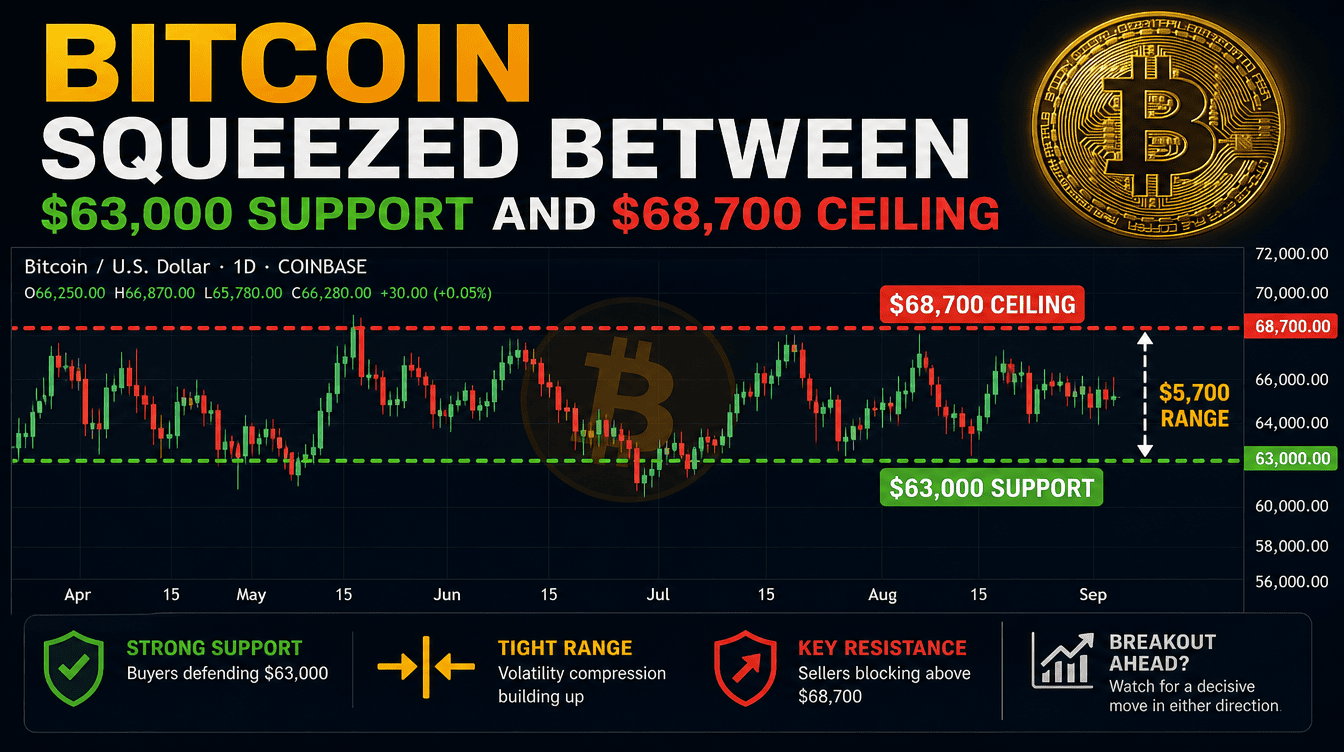
Bitcoin is stuck in a narrow $63,000-$68,700 range as weak spot activity, ETF outflows and continued whale selling leave the market exposed to a potentially sharp move.
BTC traded between roughly $63,500 and $64,000 this week, according to CoinGecko, remaining below the $65,000 mark that has proven difficult to reclaim.
Spot exchange volume for Bitcoin has fallen to its lowest level since Glassnode began tracking the metric in early 2019, data shared by Wu Blockchain showed. At the same time, Crypto Rover said BTC volatility has compressed to levels last recorded in October 2023.
The lack of movement appears to reflect more than the usual summer slowdown. Both new buying interest and forced selling have diminished, leaving Bitcoin positioned between two major cost-basis levels that are gradually converging.
Bitcoin’s $63K-$68.7K Price Range
Bitcoin is currently trading between the $63,000 median realized price and the $68,700 short-term holder cost basis.
The median realized price represents the midpoint of the cost basis across Bitcoin holders and is currently providing support. The $68,700 short-term holder cost basis represents the average entry price of recent buyers and has become a key resistance level.
Glassnode’s Week 32 analysis noted that BTC has spent nearly three months in this area, while the distance between the two boundaries has narrowed as volatility declined.
Analyst Ted Pillows highlighted Bitcoin’s inability to stay above $65,000 even as stocks and precious metals advanced, suggesting that BTC momentum may be fading. He sees the $60,500-$61,000 region as a possible downside target before a recovery attempt.
If Bitcoin loses the $63,000 median realized price, Glassnode has identified $58,500, the June low, as the next important level to monitor. The firm also warned that thin order books and elevated leverage could amplify a downside move.
Whale Selling and ETF Outflows Add Pressure
According to Lookonchain, a wallet connected to Paxos sold another 800 BTC worth about $50.72 million through Wintermute.
The wallet has now sold approximately 2,500 BTC over the past two months, worth close to $154 million. Rather than selling everything at once, the holder has gradually reduced its position. While the activity may not be enough to cause a major market sell-off on its own, it adds supply during a period of weak demand.
U.S. spot Bitcoin ETFs posted $61.16 million in net outflows on Aug. 12, with Fidelity’s FBTC accounting for $46.82 million. Alongside the historically low spot volume, the withdrawals indicate that institutional demand has weakened rather than accelerated.
Potential Bullish and Bearish Paths
Bitcoin could regain upward momentum by reclaiming $68,700 and sustaining that level alongside stronger spot volume and renewed ETF inflows. Such a move could restore profitability for recent buyers and potentially lead to new local highs.
Crypto Rover pointed to October 2023, when Bitcoin volatility reached similarly compressed levels before BTC eventually surged more than 330%. While the historical comparison should not be treated as a forecast, traders are watching the pattern for clues about what may follow.
A decisive break below $63,000 would weaken the current structure and potentially send BTC toward $60,500-$61,000. If selling intensifies, $58,500 could become the next major support.
Glassnode’s seller-exhaustion indicators are approaching levels observed near previous bear-market bottoms. However, actual spot demand remains weak, with bitcoin continuing to move onto exchanges despite signs that selling pressure is beginning to fade.
A global rates shock could also disrupt the current consolidation. A sudden change in interest-rate expectations could trigger a carry-trade unwind and force Bitcoin into a more decisive direction.
For now, historically thin spot liquidity and low trading volume mean that once buyers or sellers gain control, the resulting move could be significantly larger than Bitcoin’s recent trading range suggests.