A roughly 50% drop from recent highs has pushed bitcoin into a zone typically associated with extreme market pessimism, sparking renewed debate among analysts.
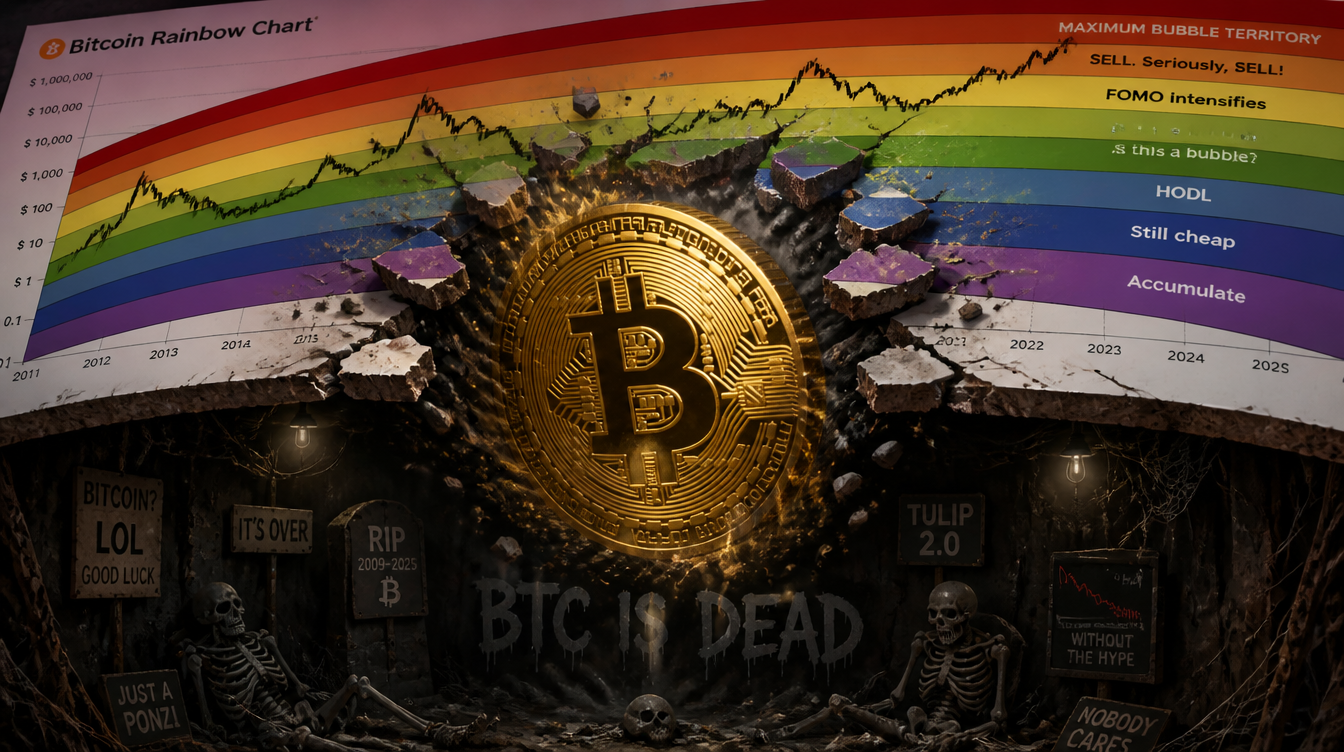
The cryptocurrency has fallen below the lowest band of the widely followed Rainbow Chart for only the second time ever. This long-standing model, developed over a decade ago, tracks bitcoin’s price cycles using a logarithmic curve and color-coded sentiment ranges.
Some market participants see the move as a potential buying opportunity. Analyst CryptoRover drew parallels to 2022, when bitcoin last entered this zone around $15,000 before eventually forming a cycle low.
Currently trading near $62,500, bitcoin is down about 50% from its October 2025 peak of $126,000. The decline has pushed it beneath the base of the modern nine-band Rainbow Chart and into the original model’s purple “Bitcoin Is Dead” zone—a level historically linked to extreme fear rather than an actual collapse.
The breakdown has fueled debate over whether bitcoin is now undervalued or whether the Rainbow Chart itself is becoming less relevant as institutional investors, ETFs and broader macro forces increasingly influence the market.
First introduced in 2014 by Reddit user Azop, the Rainbow Chart is based on historical price behavior and assigns sentiment phases through colored bands.
Analysts remain divided on its significance. Markus Levin, co-founder of XYO, believes the breach signals a structural shift in the model rather than a problem with bitcoin, suggesting the asset has matured beyond the assumptions underlying the chart.
Others take a different view. Ryan Lee, chief analyst at Bitget, said the chart still serves as a useful tool for visualizing long-term cycles, but cautioned against relying on it as a predictive model given its dependence on historical trends rather than evolving market dynamics.
Emad Shahin, COO of Ethra, also described the chart as more of a sentiment indicator than a forecasting tool, noting that such models often fail at key turning points.
Bitcoin’s inability to reach the chart’s upper red bands during its $126,000 peak—and its current move below the lower boundary—underscores a growing disconnect between price action and traditional valuation models. Other frameworks, including Stock-to-Flow, have also struggled to accurately predict recent performance.
Mark Zalan, CEO of GoMining, emphasized that the “Bitcoin Is Dead” zone has historically marked periods of extreme fear and undervaluation, often followed by recoveries rather than long-term declines.
However, he acknowledged that the model is becoming less precise as market structure evolves. The increasing role of institutional capital, ETFs and derivatives has reshaped price discovery, making legacy models less reliable on their own.
Bitcoin is now trading close to its April 2024 halving level, defying expectations tied to the traditional four-year cycle.
Levin added that the Rainbow Chart was designed for a more retail-driven and less liquid market, while today’s bitcoin operates within a much larger and more complex financial ecosystem.
Analysts also suggest that growing institutional participation may be dampening the extreme volatility that once defined bitcoin cycles.
Lee noted that while sentiment appears weak near the lower end of the chart, it does not necessarily signal further steep declines. A move toward the low-$50,000 range remains possible if risk sentiment worsens, but the chart itself offers limited insight into where a definitive bottom may form.
Whether bitcoin moves back within the Rainbow Chart’s historical range or continues trading outside it may determine whether the model remains relevant—or becomes outdated in a rapidly evolving market.