Bitcoin extended its losses in Asian trading, slipping below $63,000 as macro uncertainty and renewed tariff concerns pressured risk assets.
The leading cryptocurrency by market capitalization is now down roughly 7% for the week, trading near levels last seen on Feb. 6, when prices briefly approached $60,000, according to CoinDesk data. The pullback coincides with fresh trade policy headlines from President Donald Trump and continued volatility across AI-sensitive equities.
Matt Howells-Barby, vice president at Kraken and host of Trading Spaces, said bitcoin’s decline reflects the broader risk-off tone in global markets. He noted that renewed tariff-related uncertainty — similar to market reactions seen earlier this year — has weighed on sentiment, while rising geopolitical tensions may add further near-term downside pressure.
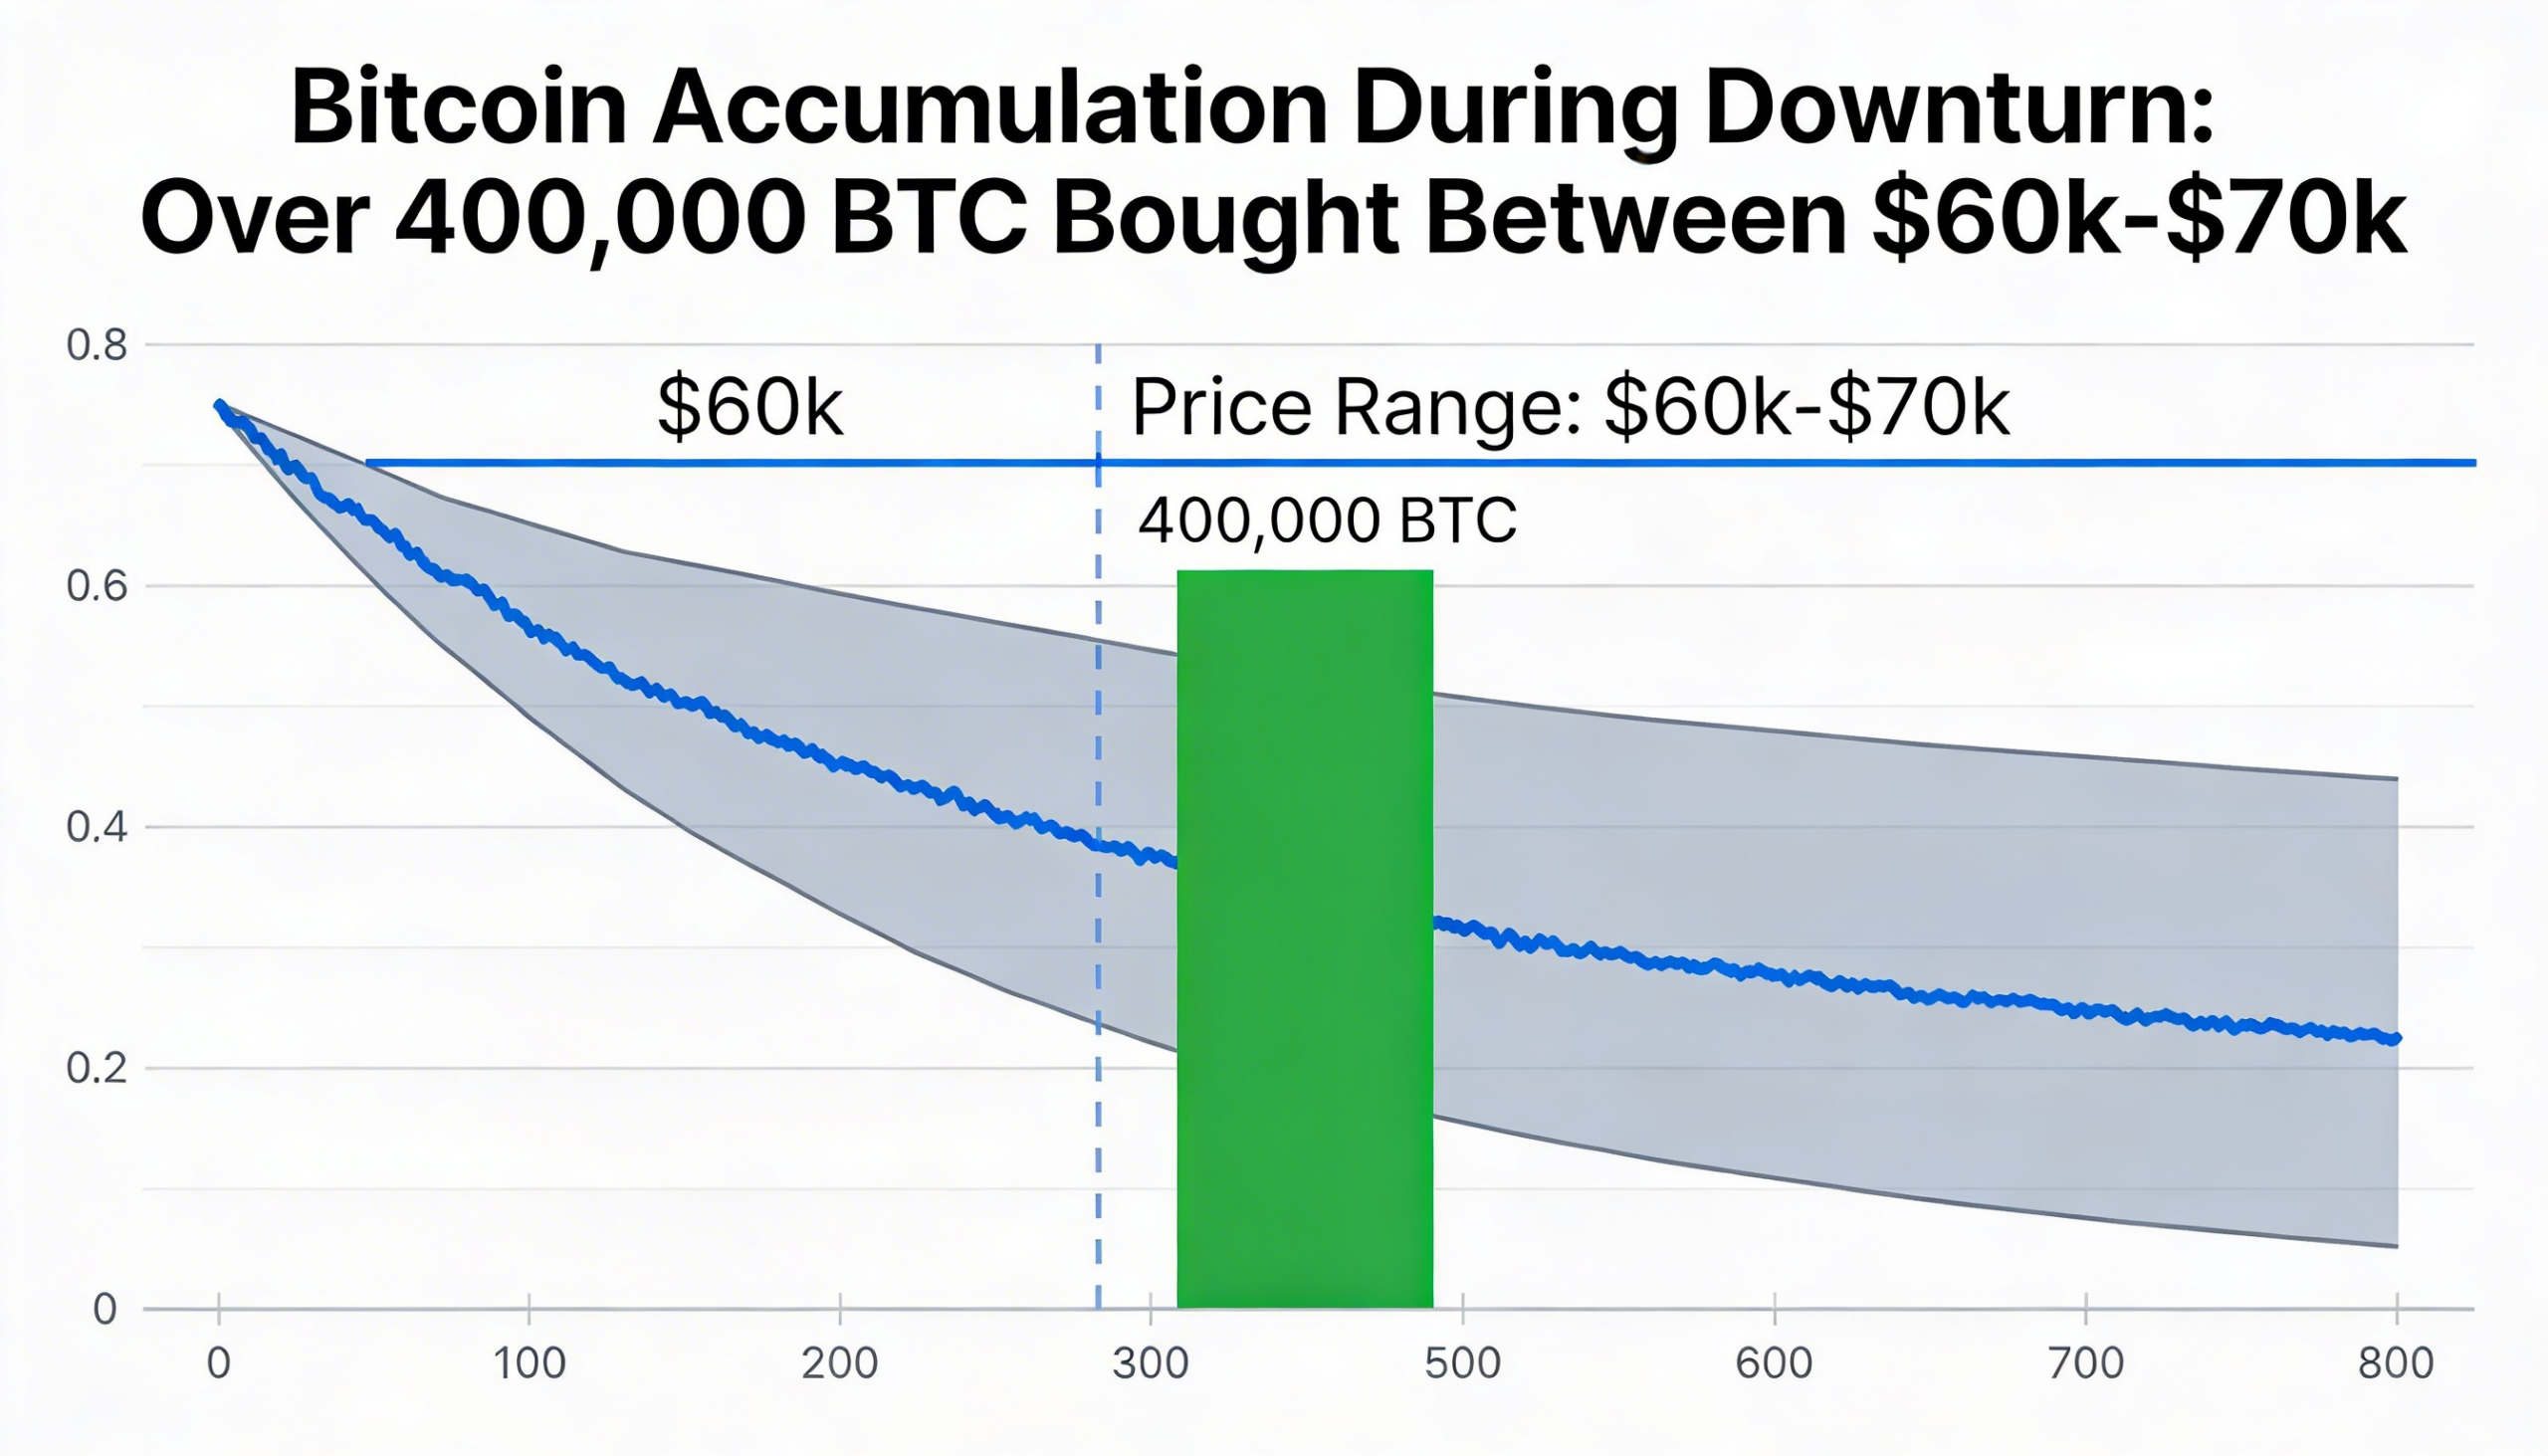
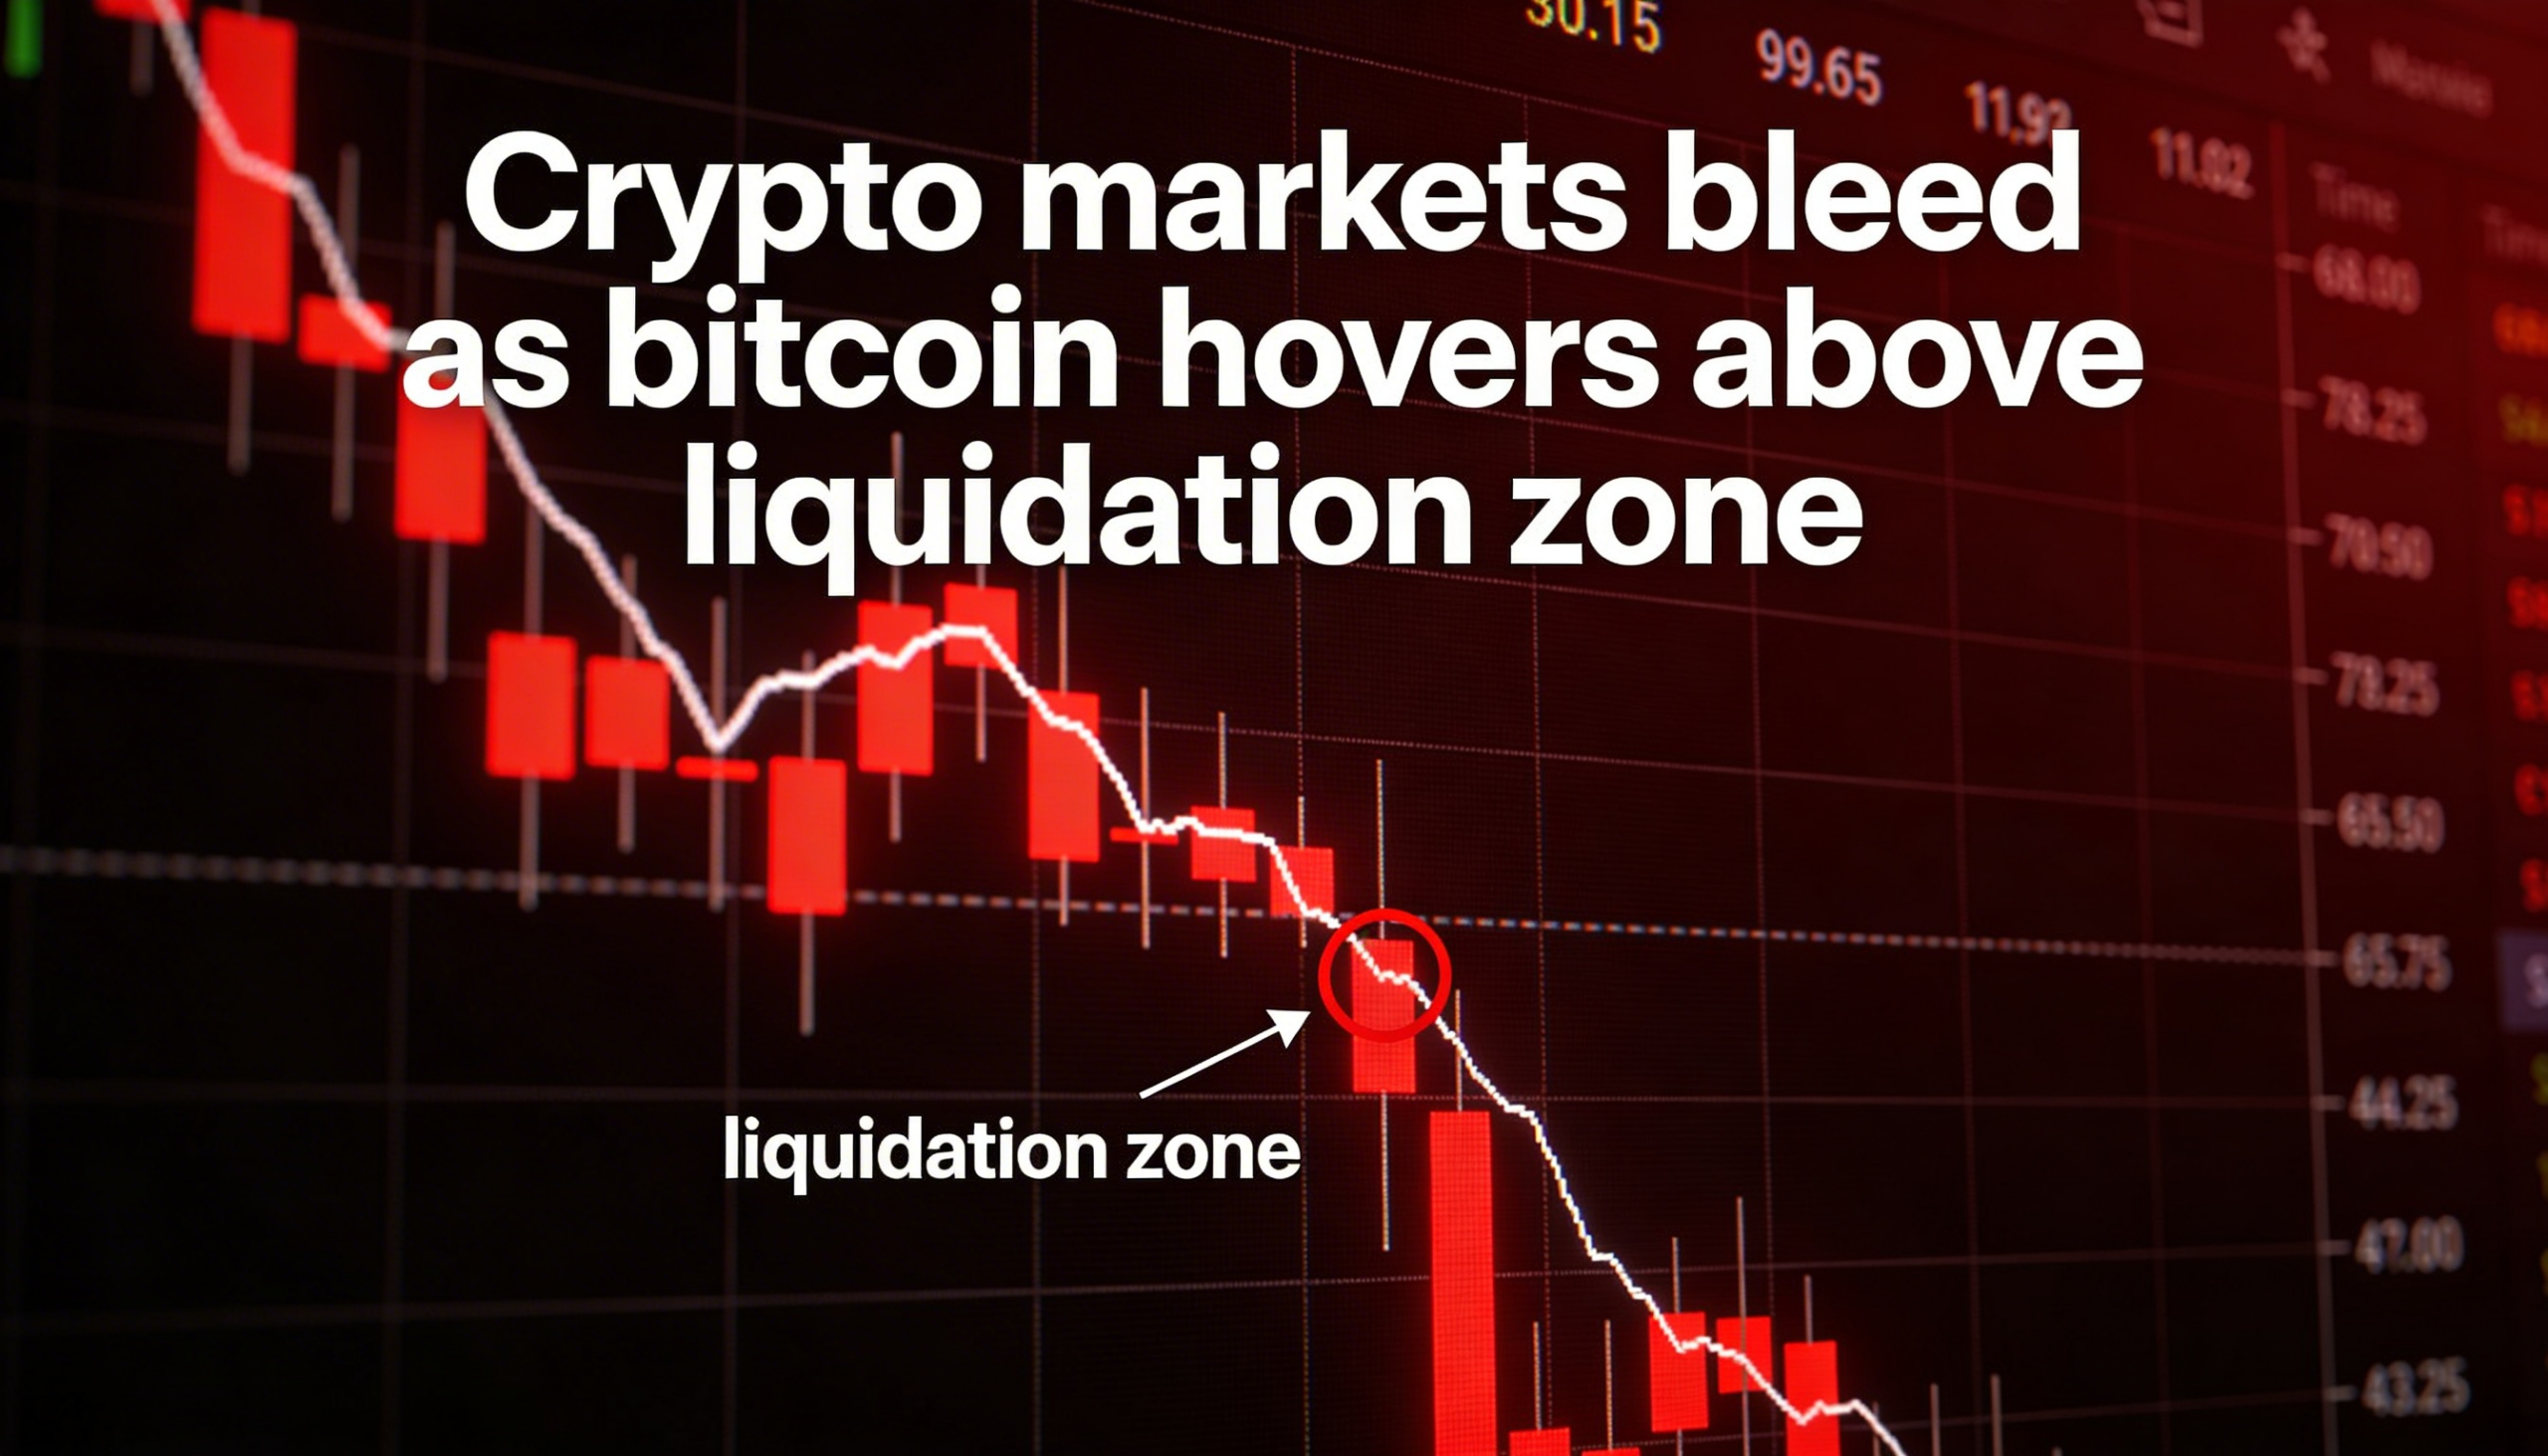
He highlighted $60,000 as a critical support level for bulls. A sustained break below that threshold could open the path toward the mid-to-low $50,000 range.
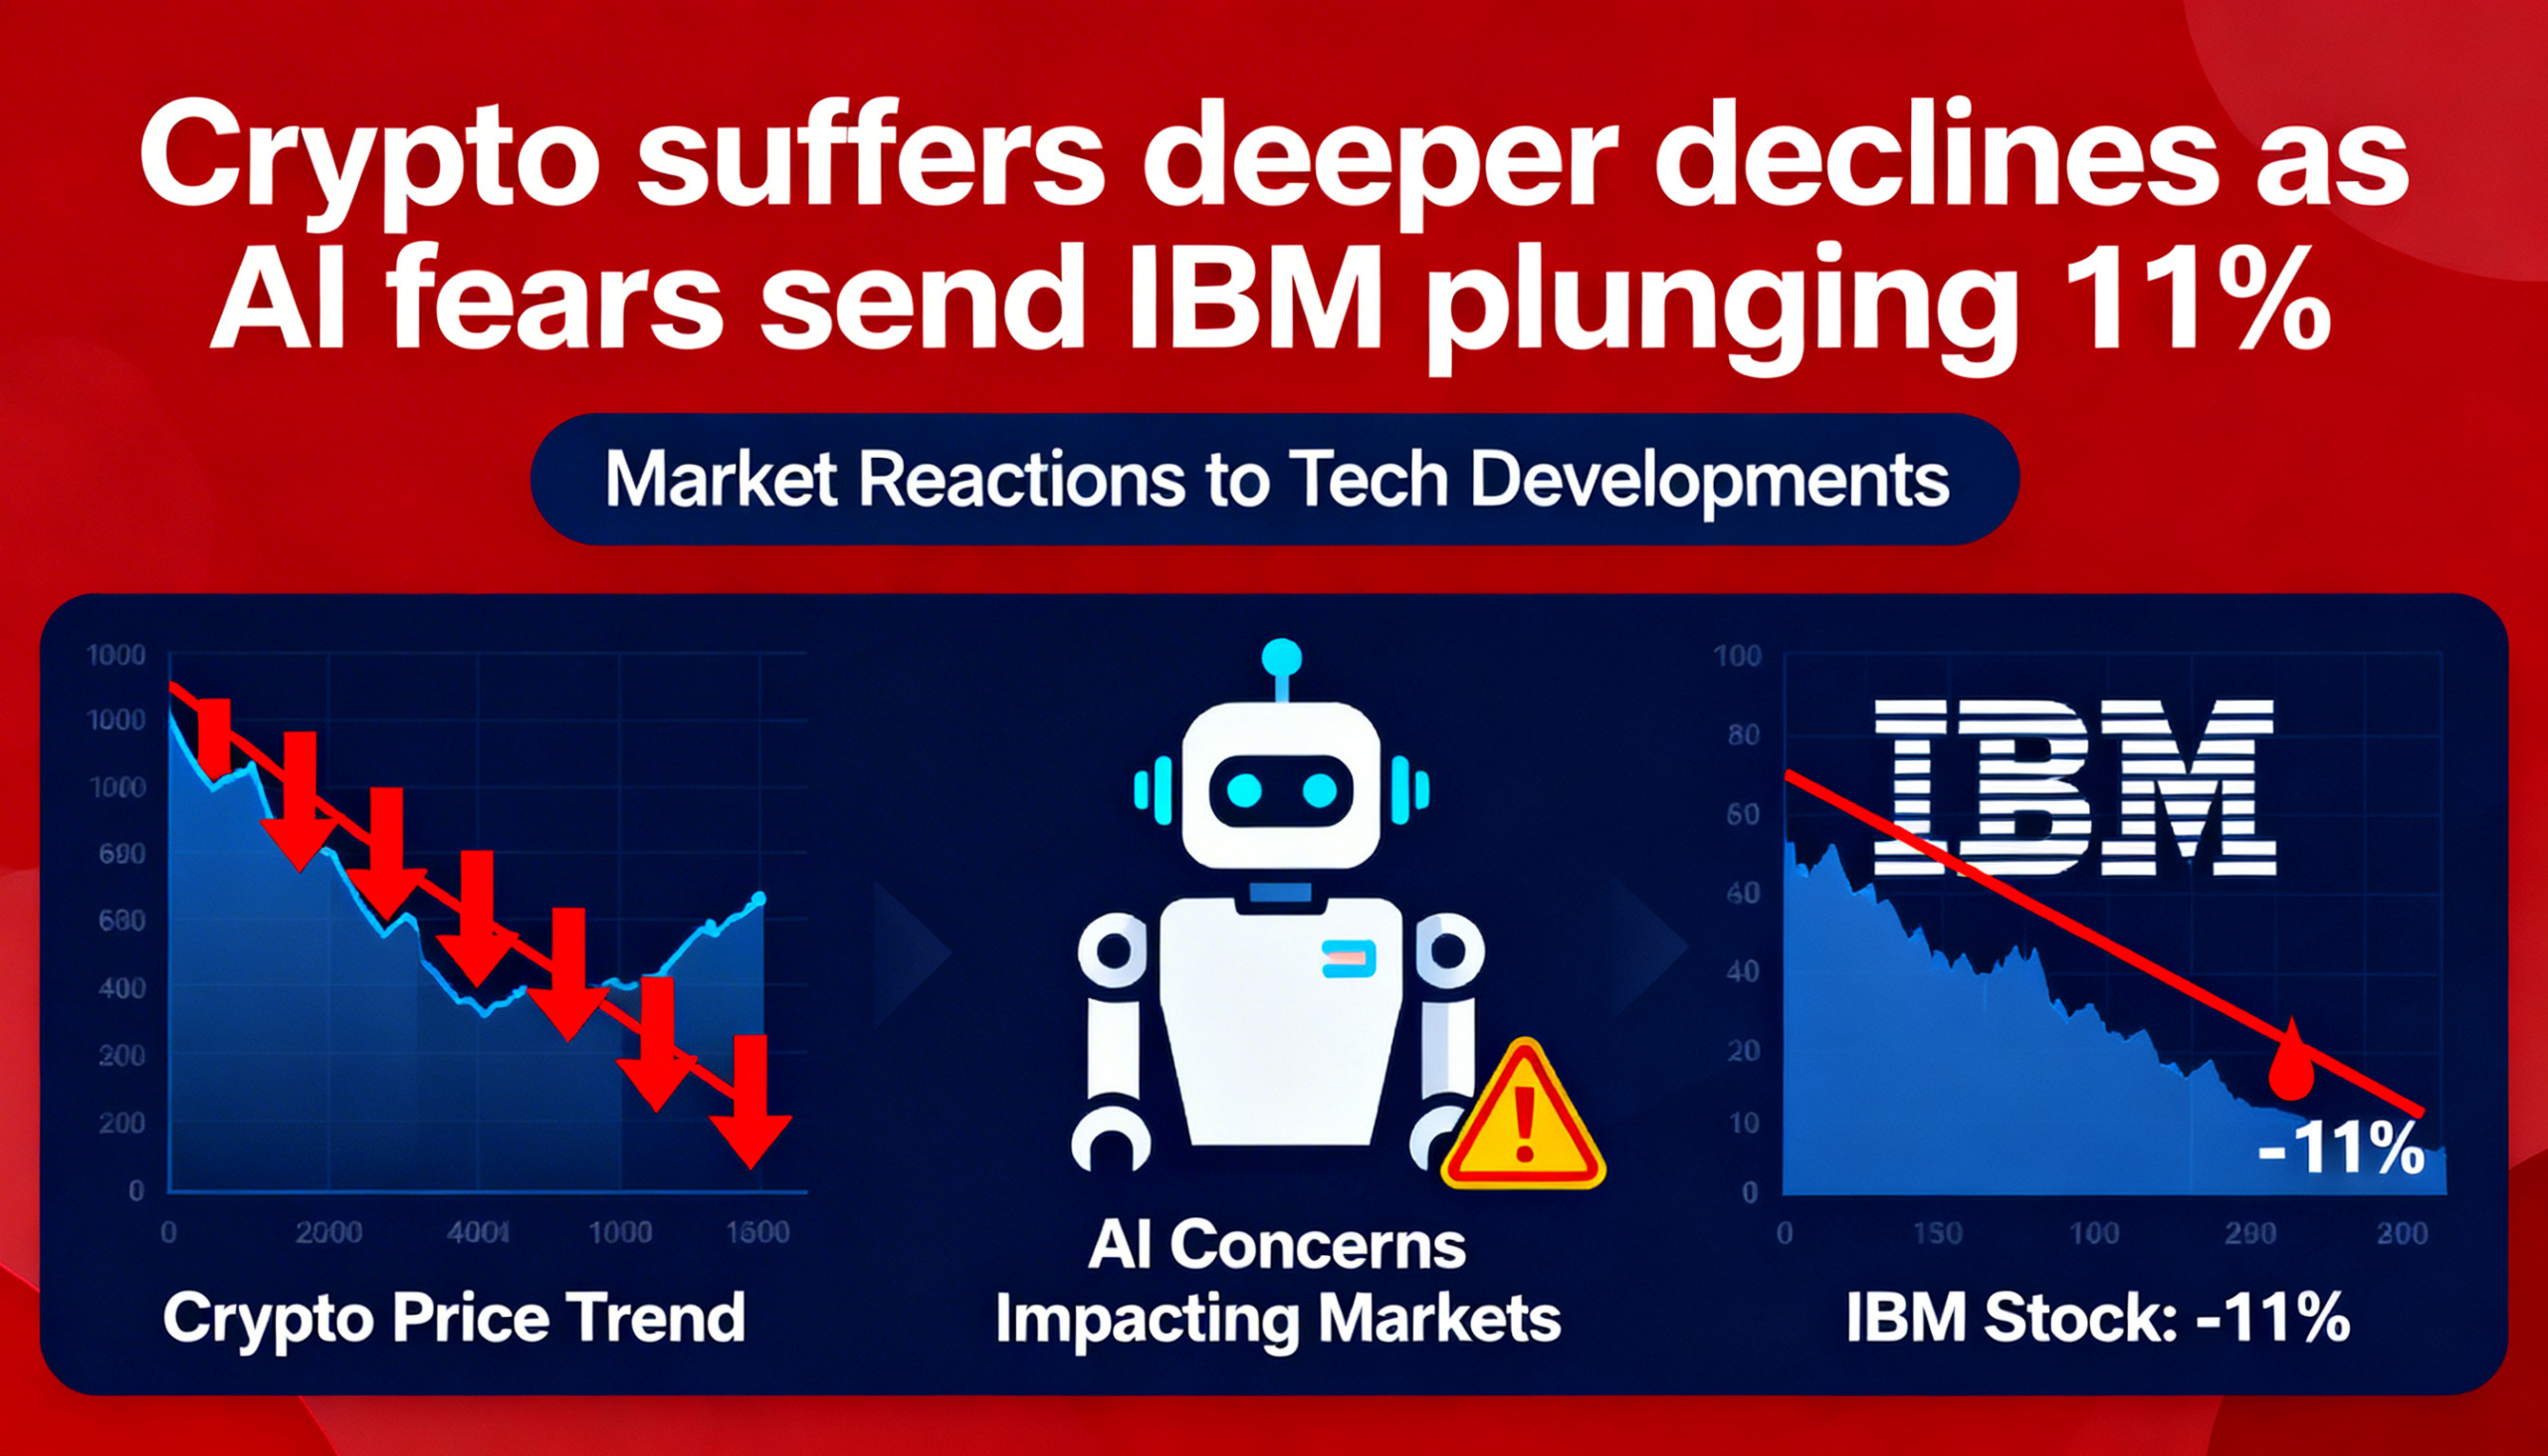
U.S. stocks also fell after Trump announced plans to impose temporary 15% tariffs on imports, up from the 10% rate outlined days earlier, following a decision by the Supreme Court of the United States that invalidated his previous tariff framework. Investors have simultaneously rotated out of companies perceived as vulnerable to disruption from artificial intelligence advancements.
Historical Patterns Suggest Further Weakness Possible
From a technical standpoint, bitcoin may not yet be near a definitive cycle bottom. In prior downturns — including 2018 and 2022 — BTC established durable lows only after its 50-week moving average crossed below its 100-week moving average, a formation commonly referred to as a “bear cross.”
That signal has not yet appeared in the current cycle, with the 50-week average still positioned above the 100-week.
If historical trends repeat, bitcoin could see additional downside — potentially toward $50,000 or lower — before longer-term capitulation takes hold. Analysts speaking at industry events in Hong Kong have similarly cautioned that the correction may not be complete.
While the bear cross may seem to confirm weakening momentum, moving averages are inherently lagging indicators. In past cycles, the crossover has tended to coincide with the latter stages of bear markets rather than forecast them in advance.
As always, however, historical performance provides context — not certainty — for future price action.