Analysis of five years of CME bitcoin futures highlights where BTC has historically built—or failed to build—meaningful price support.
By reviewing trading activity, one can see where bitcoin (BTC $87,913.36) has spent the most time consolidating, which generally corresponds to stronger support levels. Measuring trading days within specific price bands provides a clear picture: the longer price remains in a range, the more positions are likely to have been established.
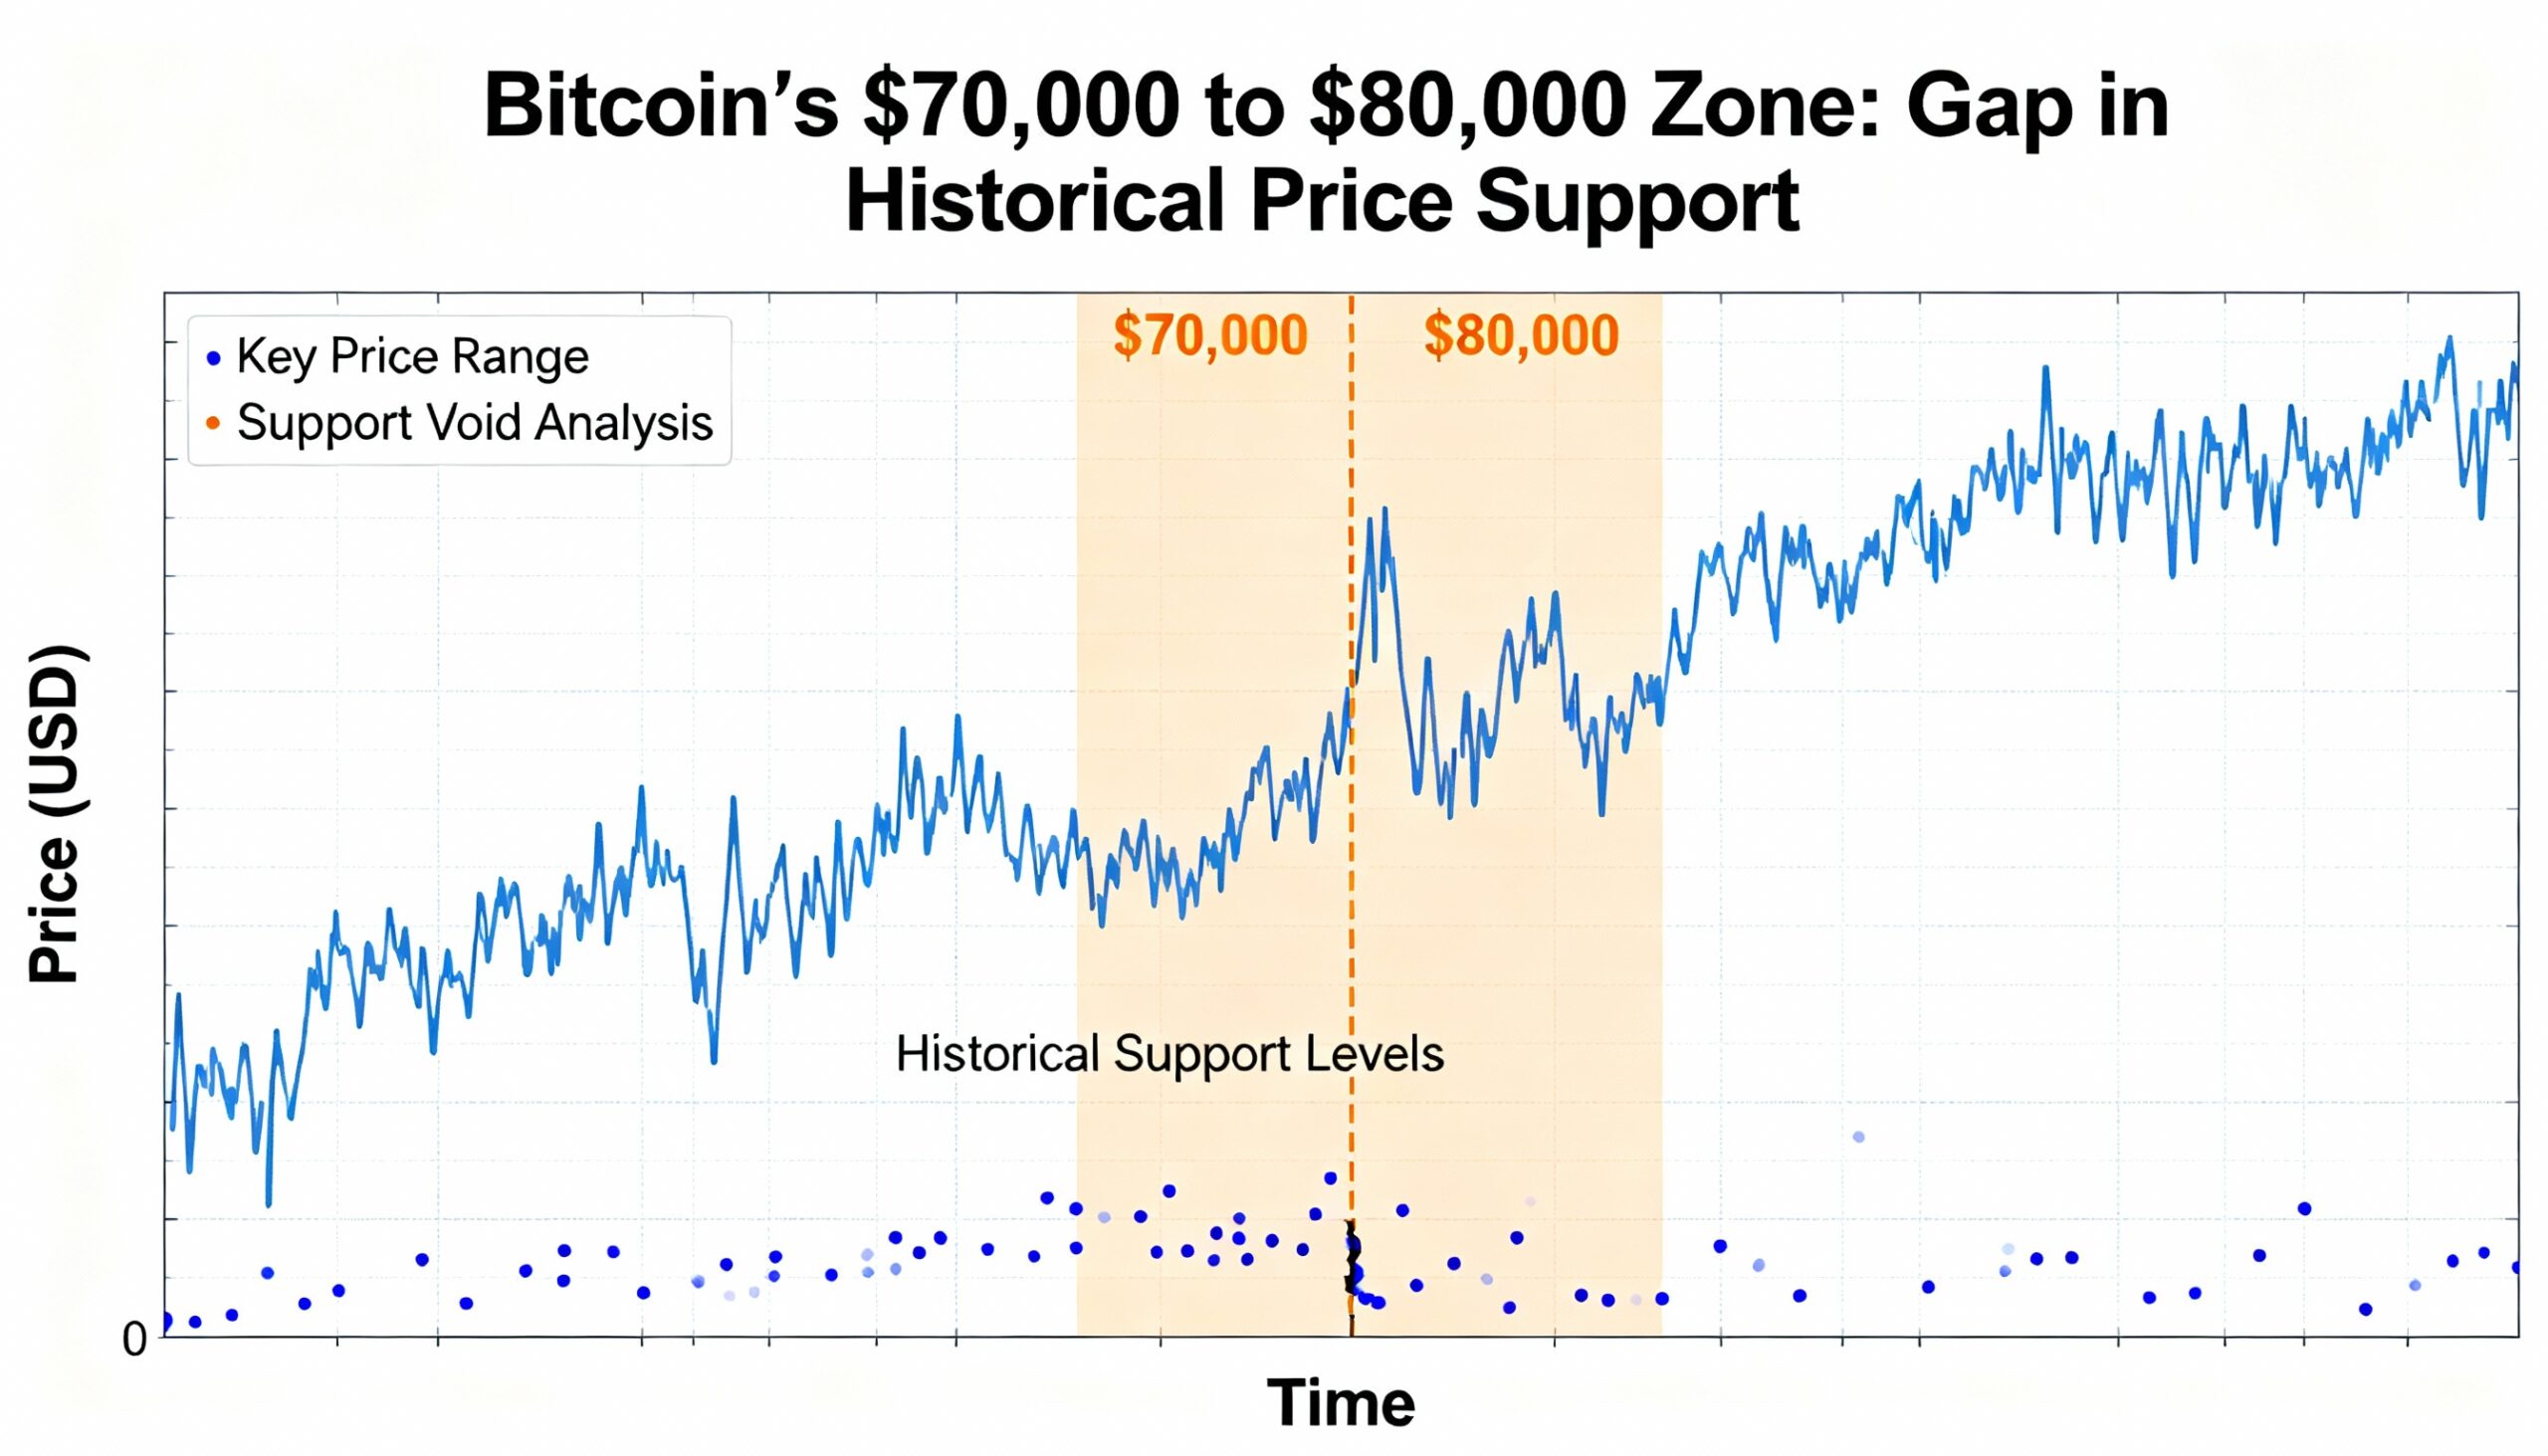
Investing.com data shows notable gaps in the higher ranges. Excluding brief periods above $120,000, bitcoin spent just 28 trading days in the $70,000–$79,999 band and 49 days in the $80,000–$89,999 range. Lower ranges, such as $30,000–$39,999 and $40,000–$49,999, saw nearly 200 trading days, indicating far more extensive testing and consolidation.
After its October peak, bitcoin has traded mostly in the $80,000–$90,000 zone. This puts it in an area historically tested far less than lower ranges, suggesting support is thinner in the $80,000s and particularly between $70,000 and $79,999.
Glassnode’s UTXO Realized Price Distribution (URPD) confirms the limited supply concentrated in the $70,000–$80,000 range, aligning with the futures data. Together, these indicators imply that if bitcoin experiences another correction, the $70,000–$80,000 zone could be a critical area for price to consolidate and establish stronger support.