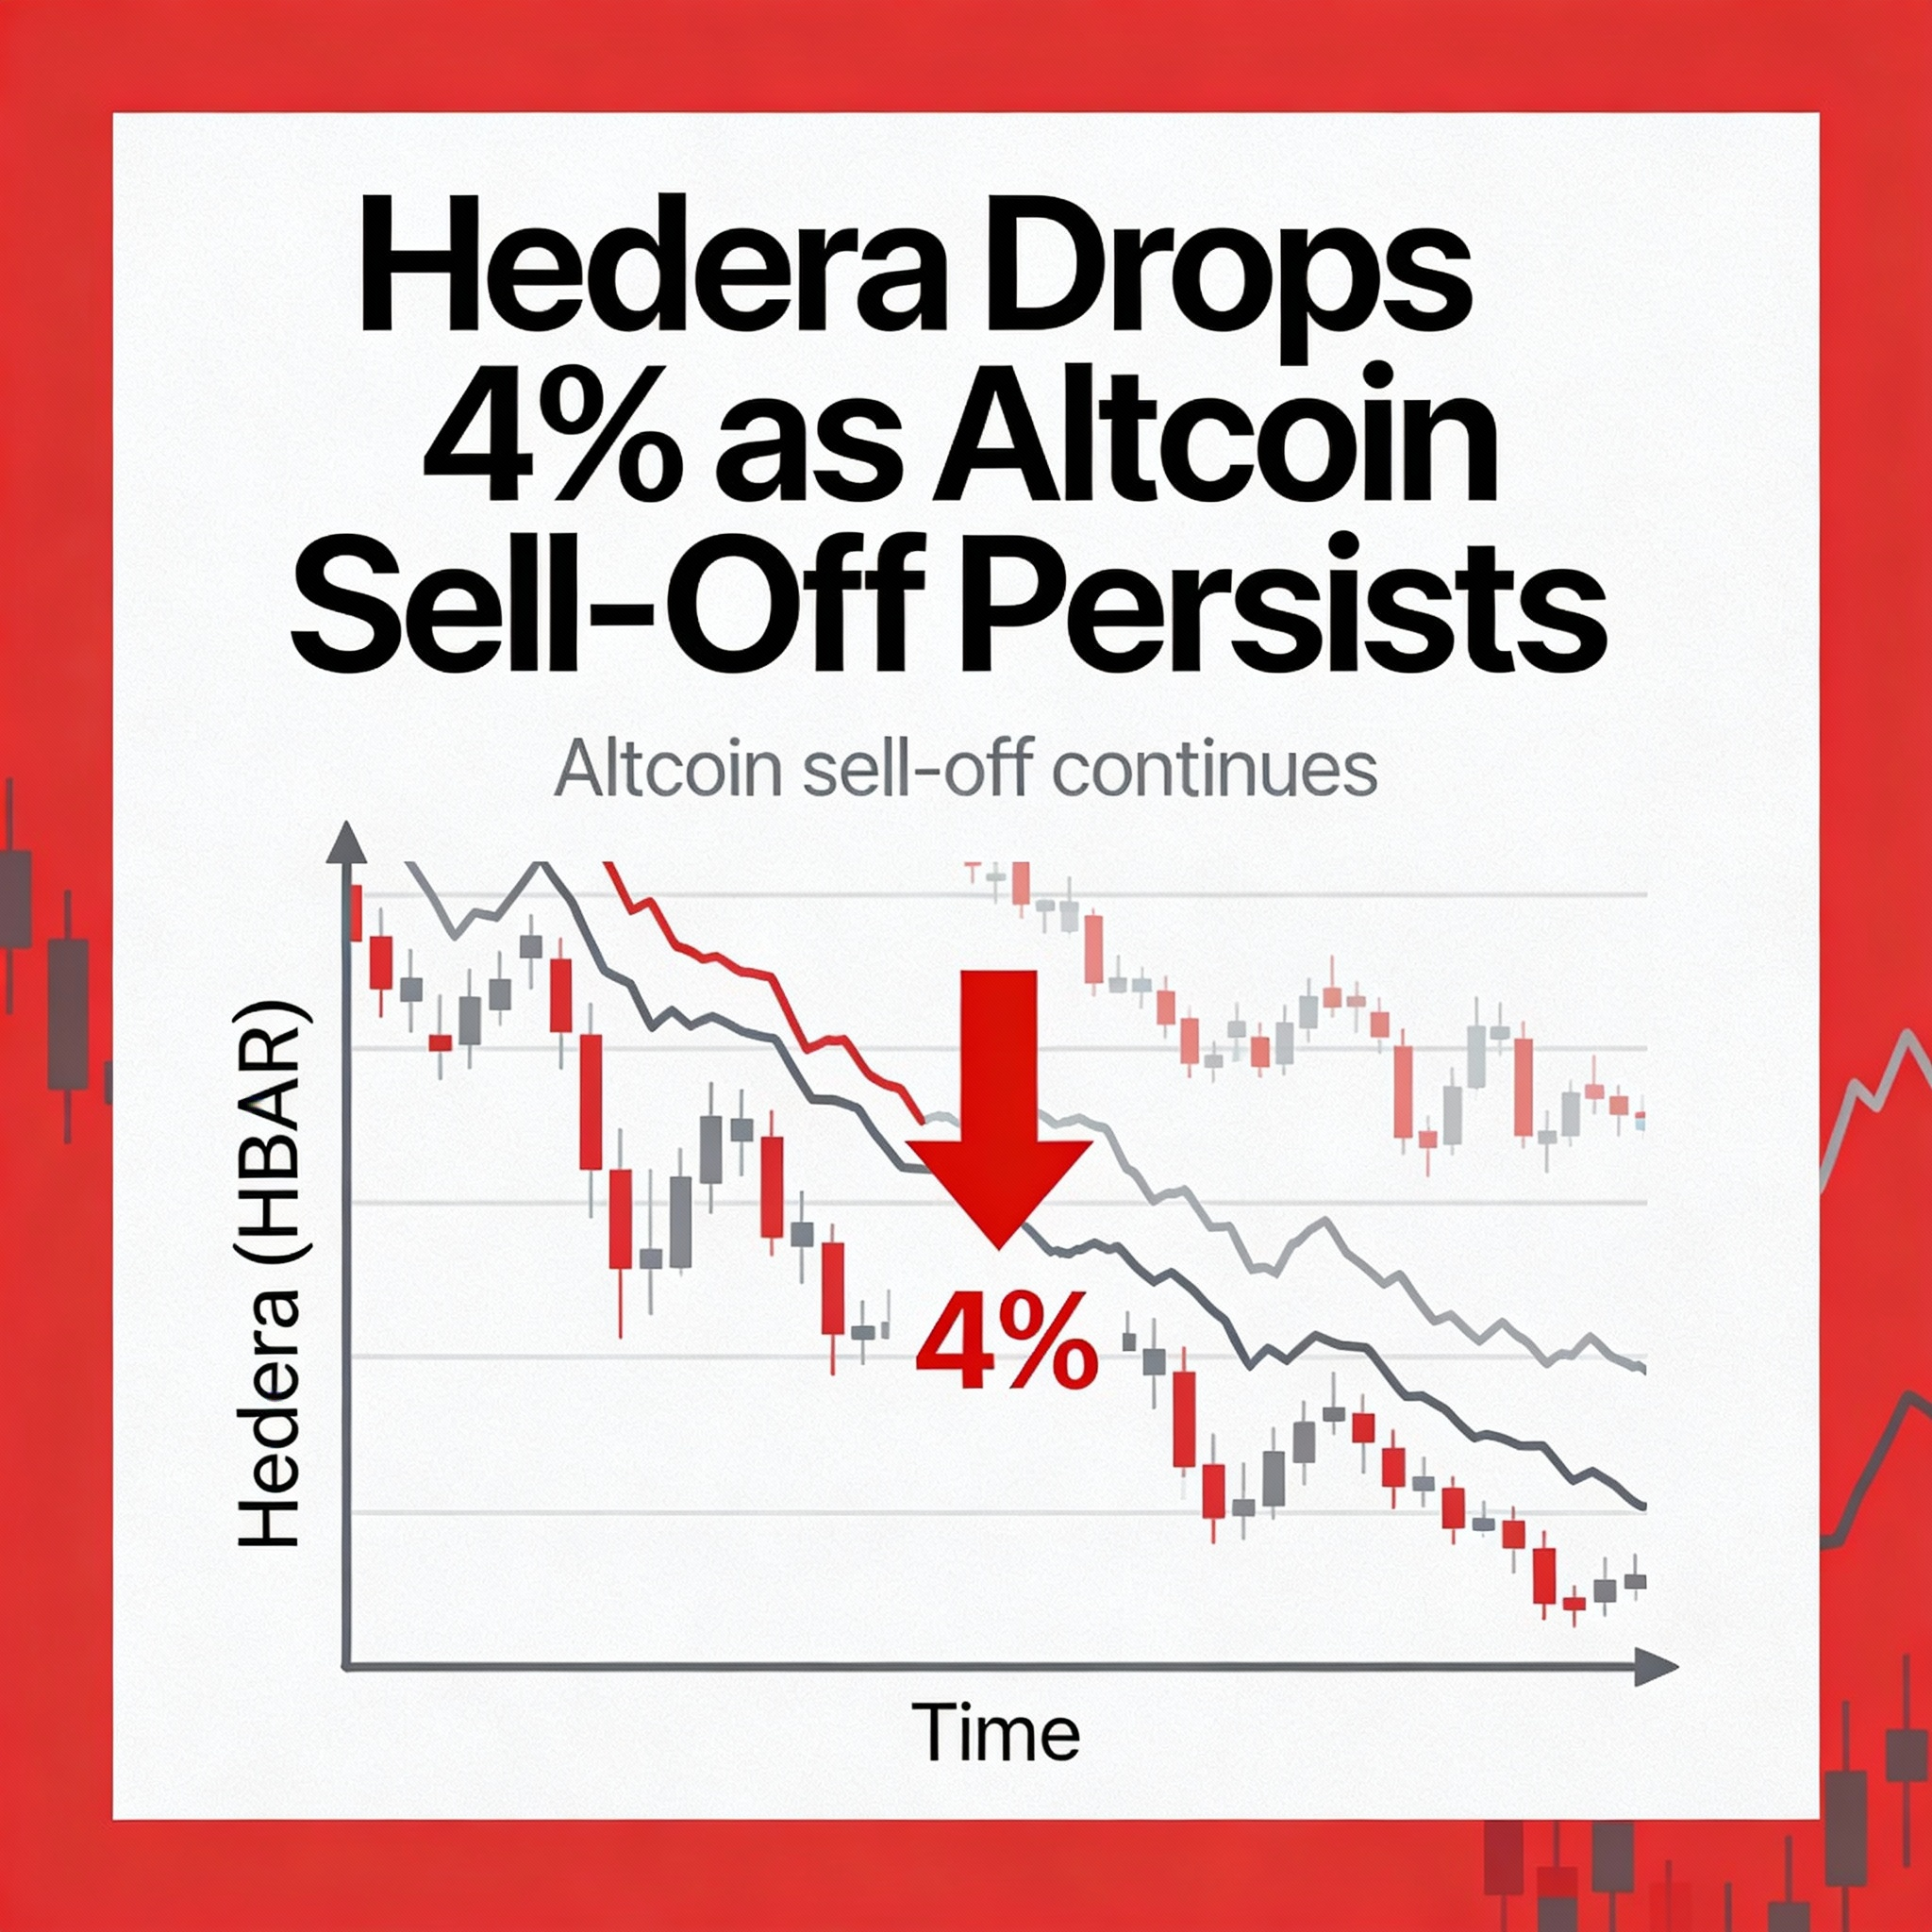
Hedera’s native token pulled back from key resistance on Thursday as heavy institutional volume accompanied a sharp intraday reversal.
HBAR slid 4% to $0.1247 following an afternoon selloff that cut through multiple technical levels, erasing earlier gains and reinforcing bearish momentum. The move produced a $0.0082 trading range, reflecting 6.4% volatility, after repeated attempts to clear resistance at $0.1320 failed.
Trading activity surged well above average throughout the session, signaling broad participation rather than thin-liquidity price swings common among smaller altcoins. The elevated volume points to active price discovery as larger players repositioned during the decline.
The afternoon drop marked a clear lower-high formation relative to the Dec. 11 peak, further deteriorating market structure and accelerating downside pressure as HBAR fell through previously established support zones.
Attention now turns to the $0.1235 level, which has emerged as critical near-term support. Following a brief capitulation, prices stabilized in the $0.124–$0.125 zone, opening the door to a potential mean reversion move toward $0.126 resistance.
Despite the modest rebound, sentiment remains cautious. The decisive loss of higher-timeframe support—combined with unusually strong sell-side volume—suggests conviction selling, limiting near-term upside even as buyers attempt to defend current levels.
Key Technical Levels Point to Consolidation
Support and Resistance
- Immediate support formed at $0.1235 after the afternoon decline
- Strong resistance reaffirmed at $0.1320 following multiple rejections
- Near-term trading range developing between $0.123 and $0.125 on 60-minute charts
Volume Analysis
- Trading volume surged to 165.9 million tokens, 175% above the 24-hour average
- Hourly flash-crash volume peaked at 15.7 million tokens, roughly 700% above normal
- Sustained elevated activity underscores institutional involvement
Chart Structure
- Lower-highs pattern from the Dec. 11 peak confirms a bearish shift
- Flash-crash-and-recovery formation hints at accumulation near support
- Momentum deterioration across multiple support levels signals trend weakness
Targets and Risk
- Immediate upside target sits near $0.126 on a mean reversion attempt
- Downside risk extends to the $0.123 support floor if consolidation fails
- Key resistance remains at $0.1285, where the initial breakdown occurred