
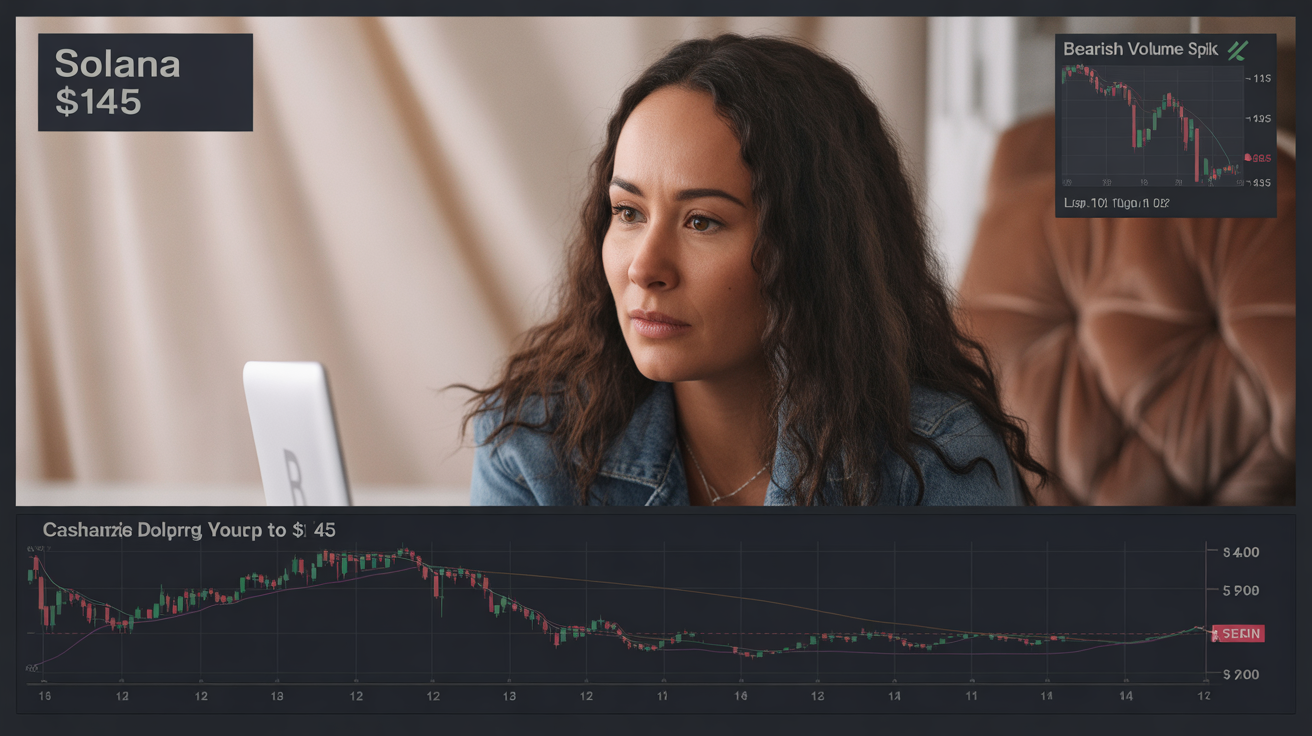
Solana Slides 5% to $145 Amid Technical Breakdown Despite ETF Inflows
Solana (SOL) fell through critical support levels on Wednesday, despite elevated trading volume and continued institutional inflows into spot ETFs.
According to CoinDesk Research’s technical model, SOL plunged 5.24% to $145.43, wiping out gains from the prior week. Trading volume surged 13.23% above weekly averages, as institutional selling dominated the session.
The sell-off intensified during the final hours of trading. SOL dropped from $153.03 to $145.31 in a wave of stop-loss triggers. Hourly closes consistently printed new lows on expanding volume, with the final 60 minutes seeing a sharp decline from $148.61 to $145.29 as bearish momentum took over.
ETF Inflows vs Technical Pressure
The downturn came amid a stark divergence between fundamental and technical signals. Spot Solana ETFs recorded their eleventh consecutive day of inflows, led by Bitwise’s BSOL, which now holds $369 million in assets.
Meanwhile, on-chain metrics painted a weaker picture. Daily active addresses fell to a 12-month low of 3.3 million, down sharply from January’s peak above 9 million. The fading memecoin-driven network activity contrasts with ongoing institutional interest, creating technical stress that resolved downward.
Technical Levels Highlight Further Risk
- Support/Resistance: The $150 support level was decisively broken; next major support lies in the $142-$144 range. Resistance now sits near $157.25.
- Volume Analysis: Volume reached 2.49 million, 157% above the daily average, signaling institutional distribution.
- Chart Patterns: A clear bearish structure is forming, with lower highs from the $157.25 peak and accelerating downside momentum.
- Targets & Risk/Reward: Initial target is the $142-$144 support zone, with potential extended weakness toward $135-$140 if selling persists.


