Bitcoin continues to frustrate traders with its range-bound, directionless price action—but certain indicators hint at a potential bullish turn.
Fed Leaves Bitcoin Largely Unmoved
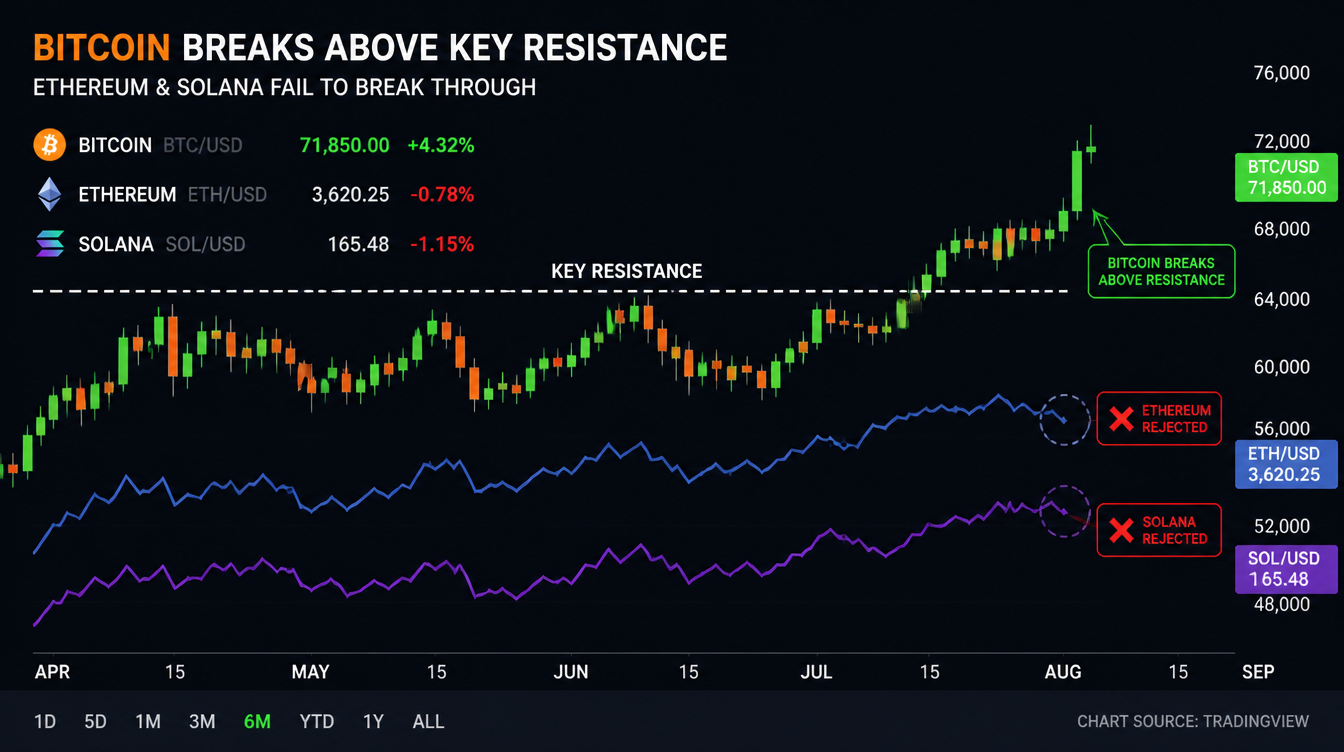
The Federal Reserve’s recent 25-basis-point rate cut, coupled with supposedly hawkish forward guidance, failed to move BTC’s price in any meaningful way. Bitcoin is currently trading around $90,244, stuck in a countertrend mini-rising channel within the broader downtrend that has persisted since its record highs.
For technical traders, the playbook is straightforward: a break above the overarching bearish trendline could signal the end of the long-term downtrend, while a drop below the ascending mini-channel would reinforce bearish momentum and open the door to deeper losses.
Indicators Point to Potential Upside
At present, the bull case appears increasingly appealing. The MACD histogram, set to (50,100,9) to capture medium-to-long-term momentum, is on the verge of crossing above zero—a classic green signal suggesting renewed bullish momentum.
The dollar index (DXY), traditionally a key headwind for Bitcoin, has softened since the Fed meeting, sliding to 98.13 on Thursday—the lowest since mid-October—and last seen at 98.36. A weaker dollar generally supports risk assets, including cryptocurrencies, and the DXY’s MACD histogram has flipped negative, signaling a bearish shift in momentum.
Meanwhile, the Nasdaq has stabilized following its November decline and now trades above its 50-, 100-, and 200-day simple moving averages, offering another positive signal for crypto markets. Sellers in Bitcoin appear to have lost steam, as BTC has held steady despite setbacks in U.S. Senate crypto legislation.
Key Levels and Resistance
If Bitcoin manages to break out, multiple resistance levels between $97,000 and $108,000 come into focus, identified by the 50-, 100-, and 200-day SMAs and the Ichimoku Cloud.
However, ETF flows remain underwhelming. In the past month, there hasn’t been a single day of net inflows exceeding $500 million, and cumulative net inflows since late November total only $219 million—a fraction of the billions in outflows seen earlier this year, according to SoSoValue.
Additionally, Bitcoin’s correlation with the Nasdaq has become asymmetric: BTC tends to fall sharply when the Nasdaq drops but rises only modestly on tech rallies.
Bear Case Still Possible
While bullish signals are mounting, the potential for a bearish breakdown cannot be ignored. A drop below the mini ascending channel would expose support around $80,000, keeping traders cautious.
For now, Bitcoin sits at a crossroads: poised for a breakout if bullish momentum holds, but vulnerable if sellers regain control.