Surging volatility, historical timing signals and relative-value indicators are intensifying debate over whether silver is approaching a blow-off top.
In the later stages of bull markets, investors often feel compelled to identify the peak. That instinct is frequently reinforced by references to famous contrarian successes, such as Michael Burry’s warning ahead of the 2007 housing downturn. As rallies accelerate and price swings widen, this behavior becomes more pronounced — dynamics now evident in silver’s recent trading.
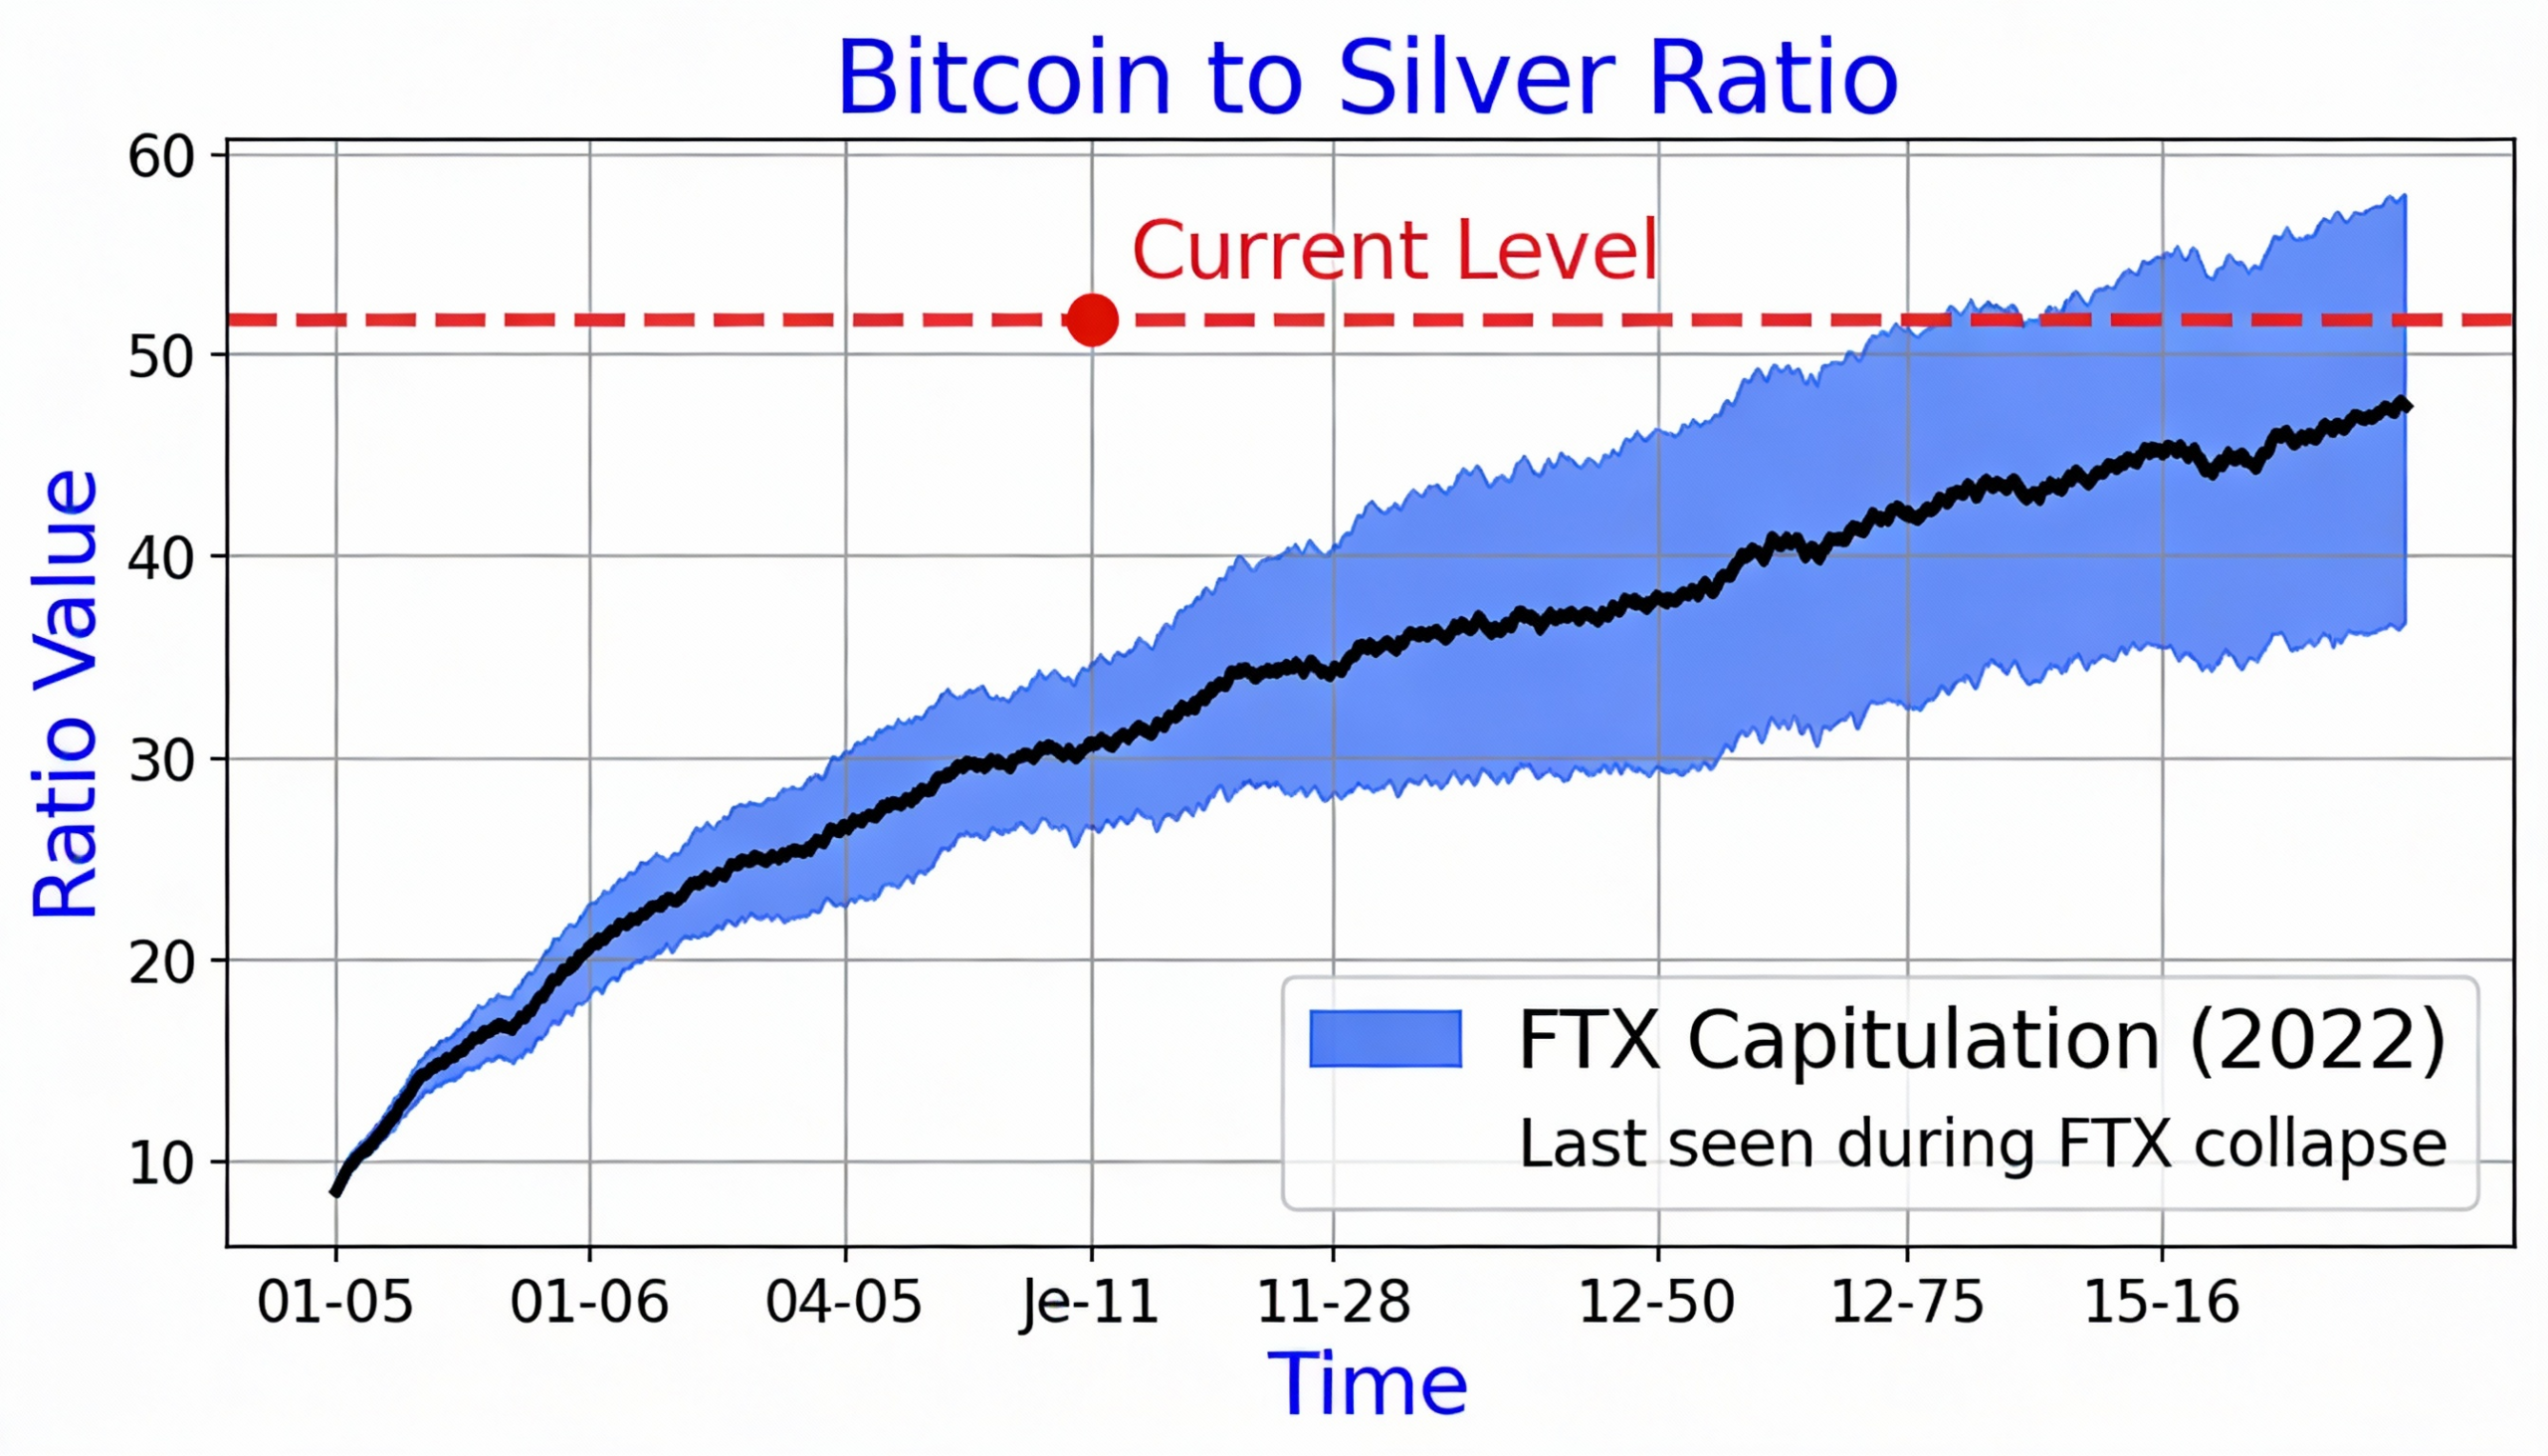
Bitcoin–Silver Ratio
The bitcoin-to-silver ratio is hovering near 780, below its 2017 high when bitcoin surged to $20,000 and close to levels seen in November 2022, when bitcoin bottomed near $15,500 and the ratio fell to roughly 700. The move suggests silver may be losing relative momentum against bitcoin.
Silver has risen nearly 300% over the past year, but the advance has been accompanied by increasing instability. On Monday, the metal suffered a sharp reversal, falling almost 15% after gaining a similar amount earlier in the session. Prices briefly touched around $117 per ounce before retreating toward $112, underscoring elevated volatility.
History adds another layer of caution. Silver’s local peaks have often formed early in the calendar year, with many occurring in the first half. Past examples include February 1974; January 1980, which marked a classic blow-off top near $47; February 1983; May 1987; February 1998; April 2004; May 2006; March 2008; and April 2011, when silver again topped near $50 during a blow-off phase.
Taken together, stretched valuations, sharp price swings and recurring seasonal patterns present a potential warning sign. If historical cycles remain relevant, silver’s recent price action may point to a cyclical high — or the late stages of an overheated rally.