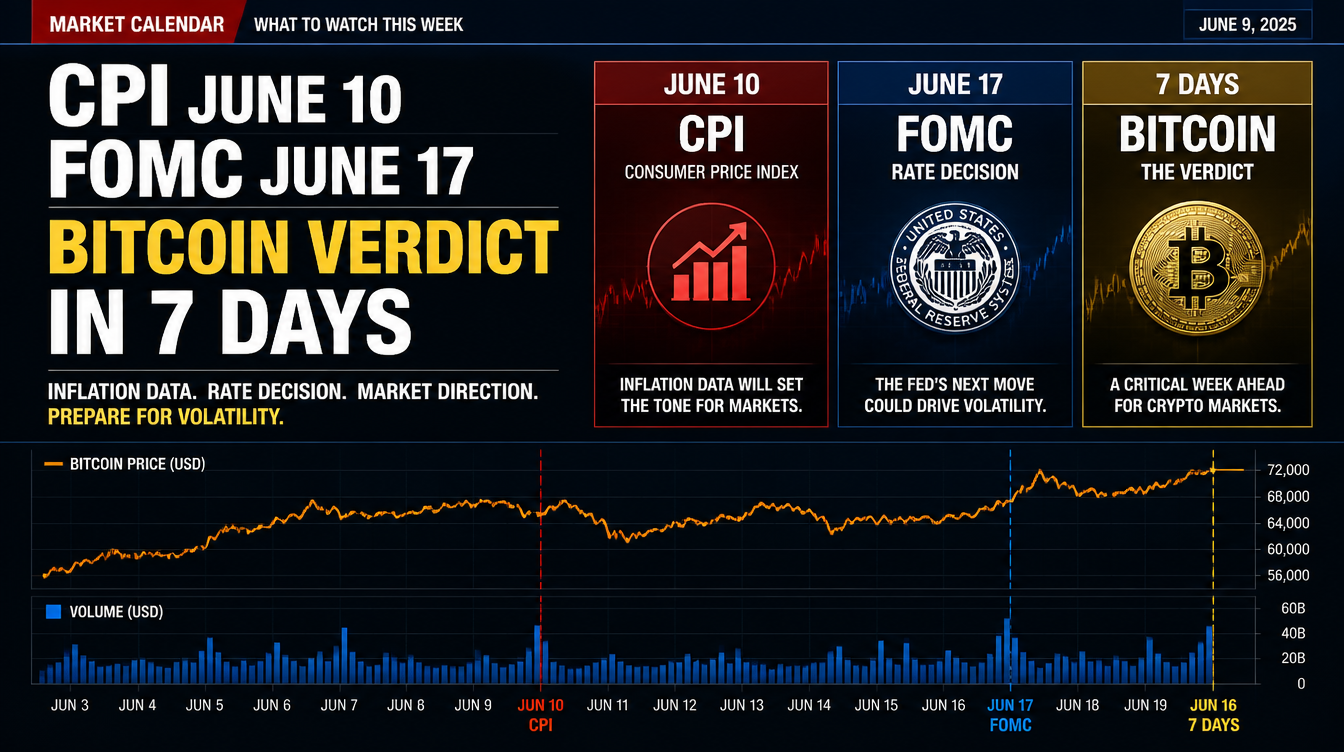
Two key macroeconomic events are poised to influence Bitcoin’s trajectory for the remainder of the year: the release of May’s Consumer Price Index (CPI) data on June 10 and the Federal Reserve’s updated FOMC dot plot on June 17. With just seven days separating the two, investors are closely watching for signals that could determine Bitcoin’s next major move.
April’s CPI rose 3.8% year-over-year, its highest level since May 2023. Markets have yet to fully reflect the implications of another elevated inflation reading on the Fed’s future rate outlook. That gap between expectations and reality could be where Bitcoin experiences a move of roughly 10% in either direction.
The chain reaction is relatively simple. Inflation data shapes expectations for the Fed’s policy projections, those projections influence real yields, real yields affect the U.S. Dollar Index (DXY), and movements in the DXY often translate into changes in Bitcoin’s price. During the June 10–17 period, all of these factors will be in play simultaneously, creating a potentially volatile setup.
The CPI–Fed–Dollar Pathway to Bitcoin
Inflation data impacts markets through three interconnected channels. First, it alters expectations regarding the number of interest-rate cuts investors anticipate from the Federal Reserve. Second, those changing expectations influence Treasury yields. Third, shifts in yield differentials between the U.S. and other economies affect the strength of the dollar. Since Bitcoin is priced in dollars and tends to move opposite to dollar strength, it reacts accordingly.
Scenario 1: Inflation Surprises to the Upside
If CPI exceeds 3.6% year-over-year, it would not be particularly unexpected considering April’s 3.8% inflation reading and producer prices rising 6.0% annually—the strongest increase since March 2022.
Another hot inflation report could lead markets to abandon expectations for Fed rate cuts in 2026, push the DXY closer to 107, tighten global liquidity conditions, and increase downside pressure on Bitcoin toward the mid-$60,000 range.
Kraken’s economic analysis notes that stronger-than-expected inflation could significantly reduce market confidence in future monetary easing.
Scenario 2: Inflation Meets Forecasts
Should CPI arrive within the 3.3%–3.6% range, the focus would shift squarely to the FOMC dot plot. If policymakers lower their projected 2026 rate cuts from two to one, the dollar may remain stable while Bitcoin consolidates ahead of the Fed’s announcement. In this outcome, volatility could remain elevated as traders await greater clarity from the central bank.
Scenario 3: Inflation Comes in Lower Than Expected
A reading below 3.0% would represent a meaningful downside surprise. Core CPI currently sits at 2.8% year-over-year and carries significant weight in the Fed’s policy decisions. Softer inflation across both headline and core measures could lead markets to price in as many as three rate cuts in 2026, weaken the dollar toward 99 on the DXY, and provide a favorable backdrop for Bitcoin and other risk assets.
Federal Reserve officials have repeatedly emphasized that inflation and labor-market conditions remain the primary factors guiding policy decisions. Before the CPI release, investors will also digest the May Nonfarm Payrolls report on June 5. April’s employment report showed payroll growth of 115,000 while unemployment held steady at 4.3%.
These economic reports are interconnected rather than isolated. Labor data influences inflation expectations, inflation affects Fed projections, and those projections shape broader market conditions. As Kraken highlighted, the sequence of NFP, CPI, PPI, and the FOMC meeting creates a clear macroeconomic roadmap in which each release helps determine the market’s reaction to the next.
Bitcoin Heads Into a Critical Technical Test
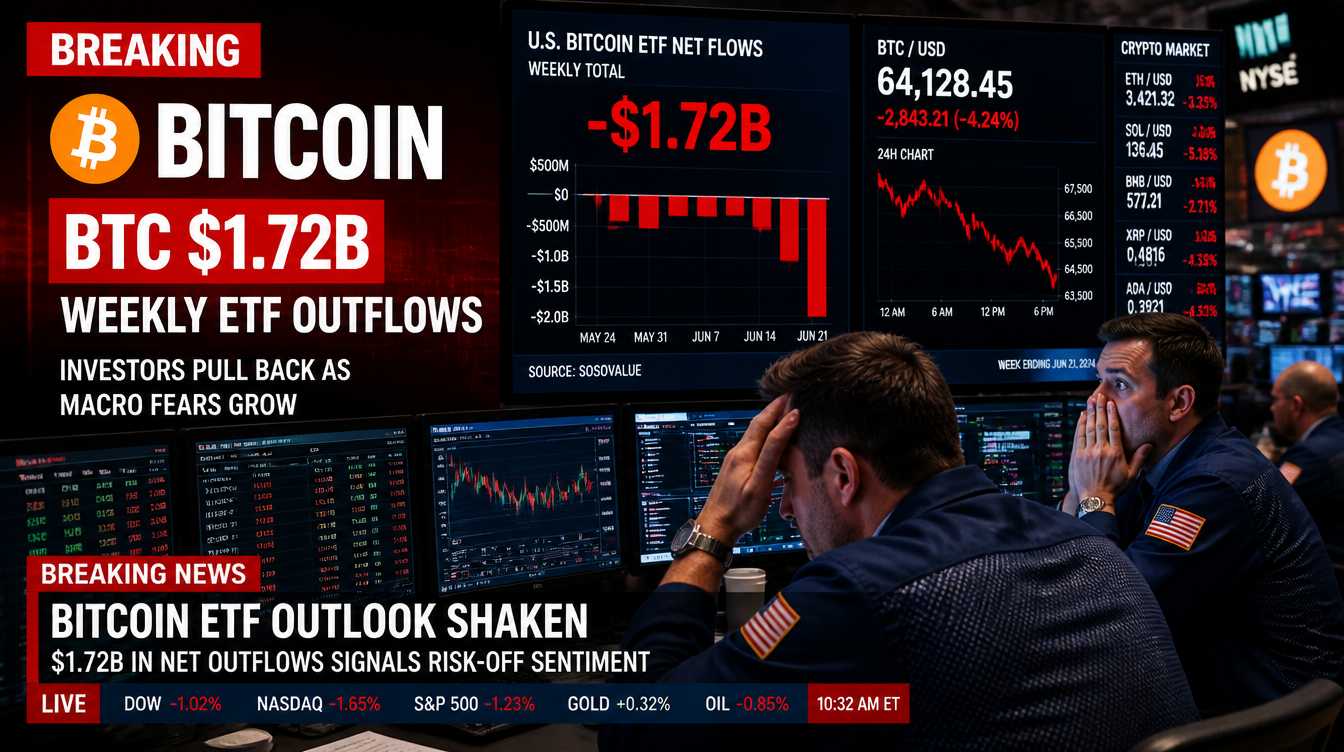
Bitcoin remains highly responsive to macroeconomic developments, as evidenced by the market’s recent removal of geopolitical risk premiums.
For now, two key price levels dominate the chart: resistance near $68,000 and support around $63,500. A weekly close above $68,000 supported by stronger volume could confirm a breakout from consolidation. On the other hand, a daily close below $62,500 may open the door for a decline toward the $60,000 area, where significant demand is expected.
Another important level sits near $65,000, representing the realized price of short-term Bitcoin holders—investors who purchased BTC within the last 155 days. This area has become a critical battleground between bullish and bearish market participants.
Momentum indicators remain balanced. Daily RSI is hovering in neutral territory, while funding rates are positive without reaching excessive levels. This suggests traders are positioned for movement but have not yet become overly leveraged.
On the weekly chart, Bitcoin continues to trade within a tightening range marked by lower highs since April and higher lows since May. Such compression is unlikely to persist through multiple inflation reports and a pivotal Federal Reserve update. The June 10–17 period is likely to determine the direction of Bitcoin’s next major trend.
Volatility appears unavoidable. What remains uncertain is whether the next move will be to the upside or downside.