Admin
Admin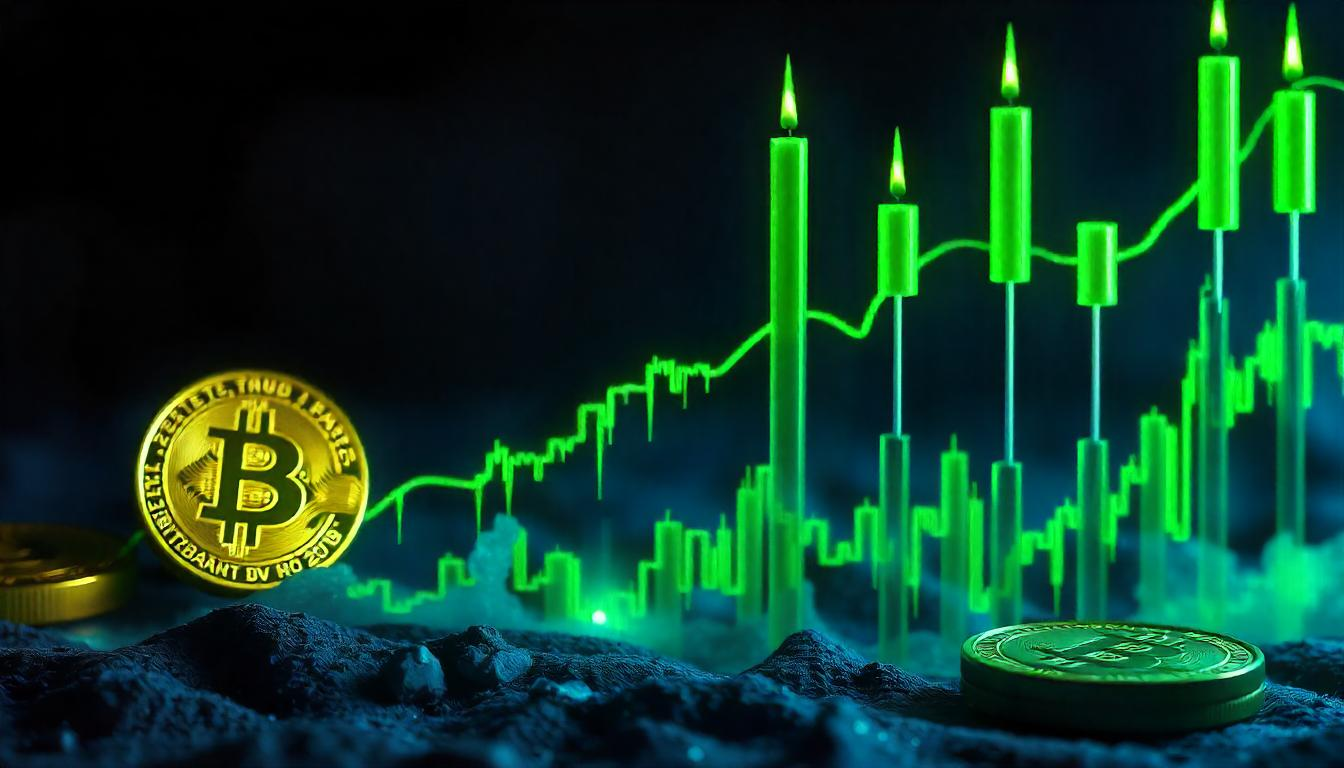
K33 Research highlights that such consistent price movements have only occurred a few times since 2017.
On Friday, during European trading hours, Bitcoin (BTC) experienced an unusual price movement that caught the attention of traders and left many scratching their heads.
If you look at the BTCUSD candlestick chart on Coinbase, you’ll notice a remarkable 14 consecutive green hourly candles, indicating that Bitcoin made gains every single hour for the last 14 hours. This bullish trend began at 21:00 UTC on January 9 and continued until 10:00 UTC on January 10, driving the price up from $91,771 to $95,283.
The continuous green candles left traders on X confused, as such a streak is a rare sight.
Vetle Lunde, Senior Analyst at K33 Research, examined historical data to identify when this type of price movement occurred previously. The current 14-hour streak is the longest since January 1, 2017, when Bitcoin experienced 11 consecutive green hourly candles.
Bitcoin has also seen similar price patterns on January 14, 2023 (11 green hourly candles), February 26, 2024 (11), and November 12, 2024 (11).
Currently, the 15th hourly candle is red, potentially signaling the end of this unusual streak, with the candle set to close at 12:00 UTC.


 cpeditor