Bitcoin’s (BTC) price action in recent weeks has reignited bullish excitement, but a growing chorus of on-chain indicators suggests the current rally could be losing steam — drawing unsettling comparisons to the infamous double top pattern of 2021.
Now trading just below January’s record high of $109,000, Bitcoin’s surge has been fueled by easing macroeconomic tensions and renewed institutional interest. Yet the rally, while impressive on the surface, is beginning to show technical fragility.
Déjà Vu: A Familiar Pattern?
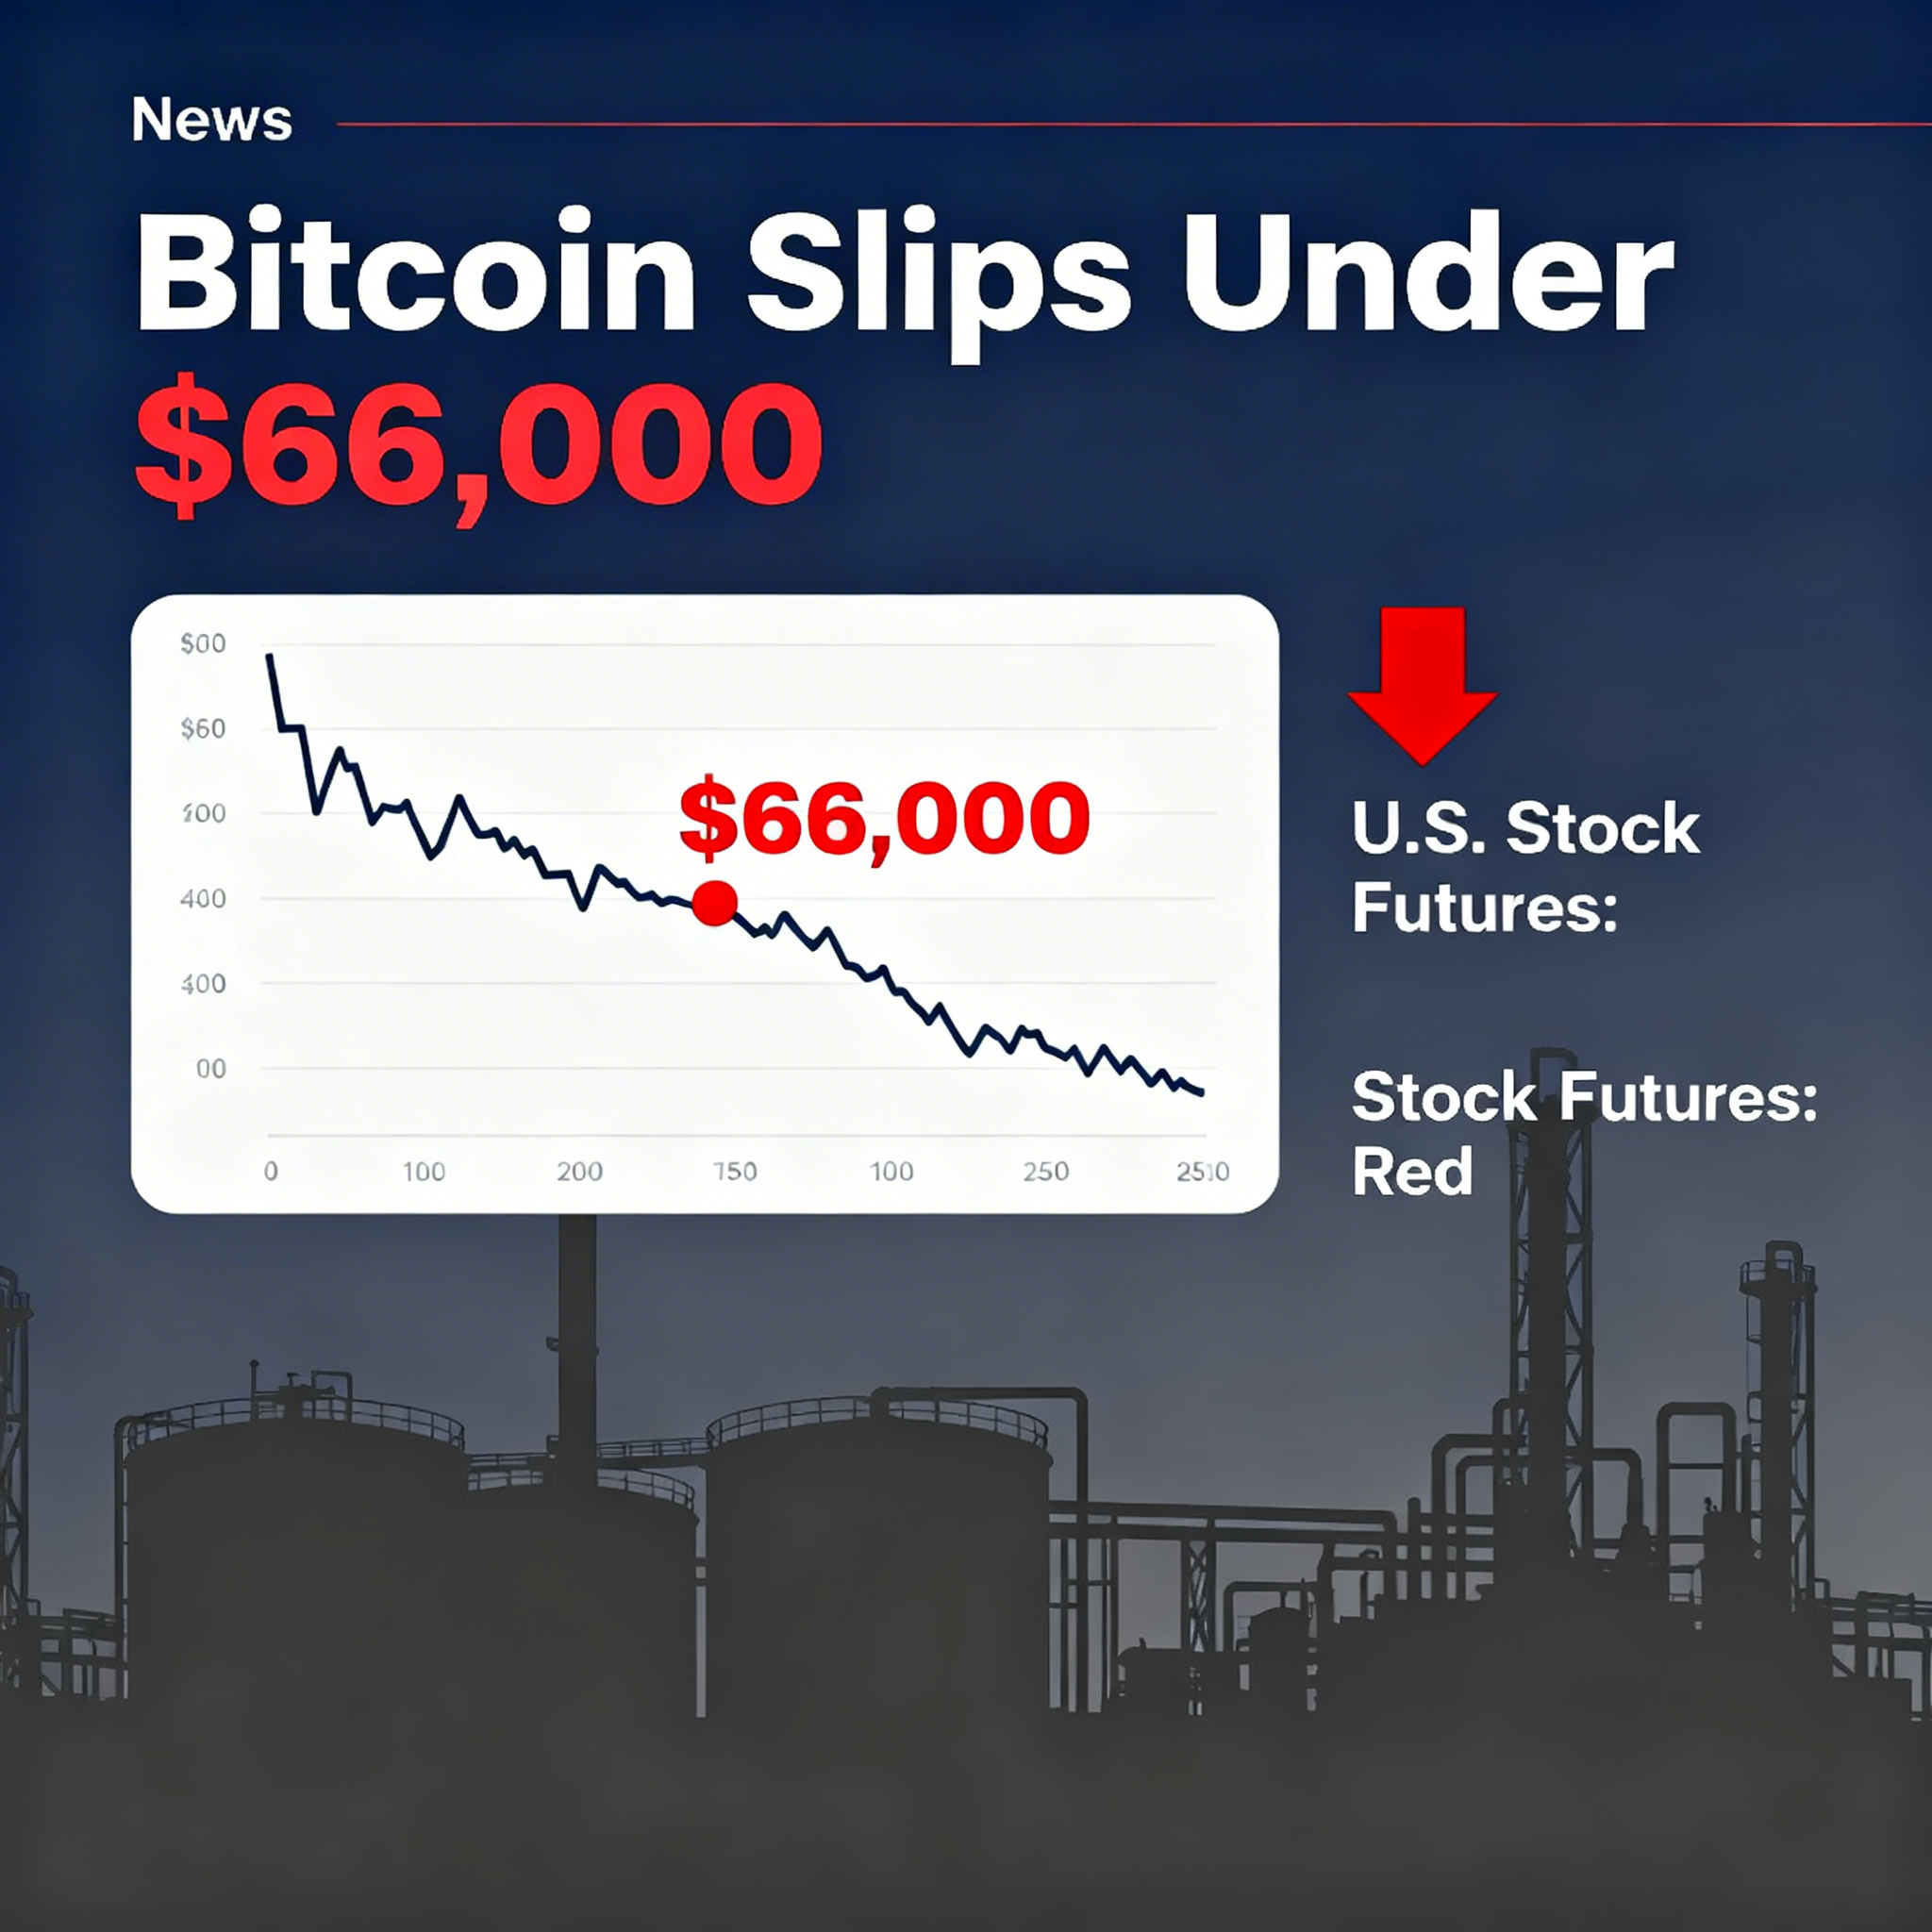
In 2021, Bitcoin first peaked at $65,000 during a wave of hype driven by MicroStrategy’s accumulation spree and Coinbase’s public listing. What followed was a sharp correction and months of uncertainty — before BTC inexplicably reversed course and surged to a new high of $69,000 later that year.
Despite negative on-chain data, that second run stunned even seasoned analysts. Today, the setup looks eerily similar.
Weakening Internals Behind the Rally
Three separate bearish divergences in Bitcoin’s weekly Relative Strength Index (RSI) — in March and December of 2024 and again this month — are the first red flags. While price has continued to climb, the RSI has not confirmed the move, indicating diminishing buying strength.
Trading volume further supports this. CME Bitcoin futures — a popular institutional vehicle — are seeing much lighter activity compared to January, with contract volumes rarely exceeding 35,000 in recent weeks. That’s nearly half the volume seen during BTC’s initial break above $100,000.
Open interest is also trailing. Despite price being just 5.8% off its all-time high, open interest has dropped 13% from January levels. A similar divergence marked the 2021 double top, when open interest fell as prices pushed toward $69,000.
A Different Landscape, But Similar Risks
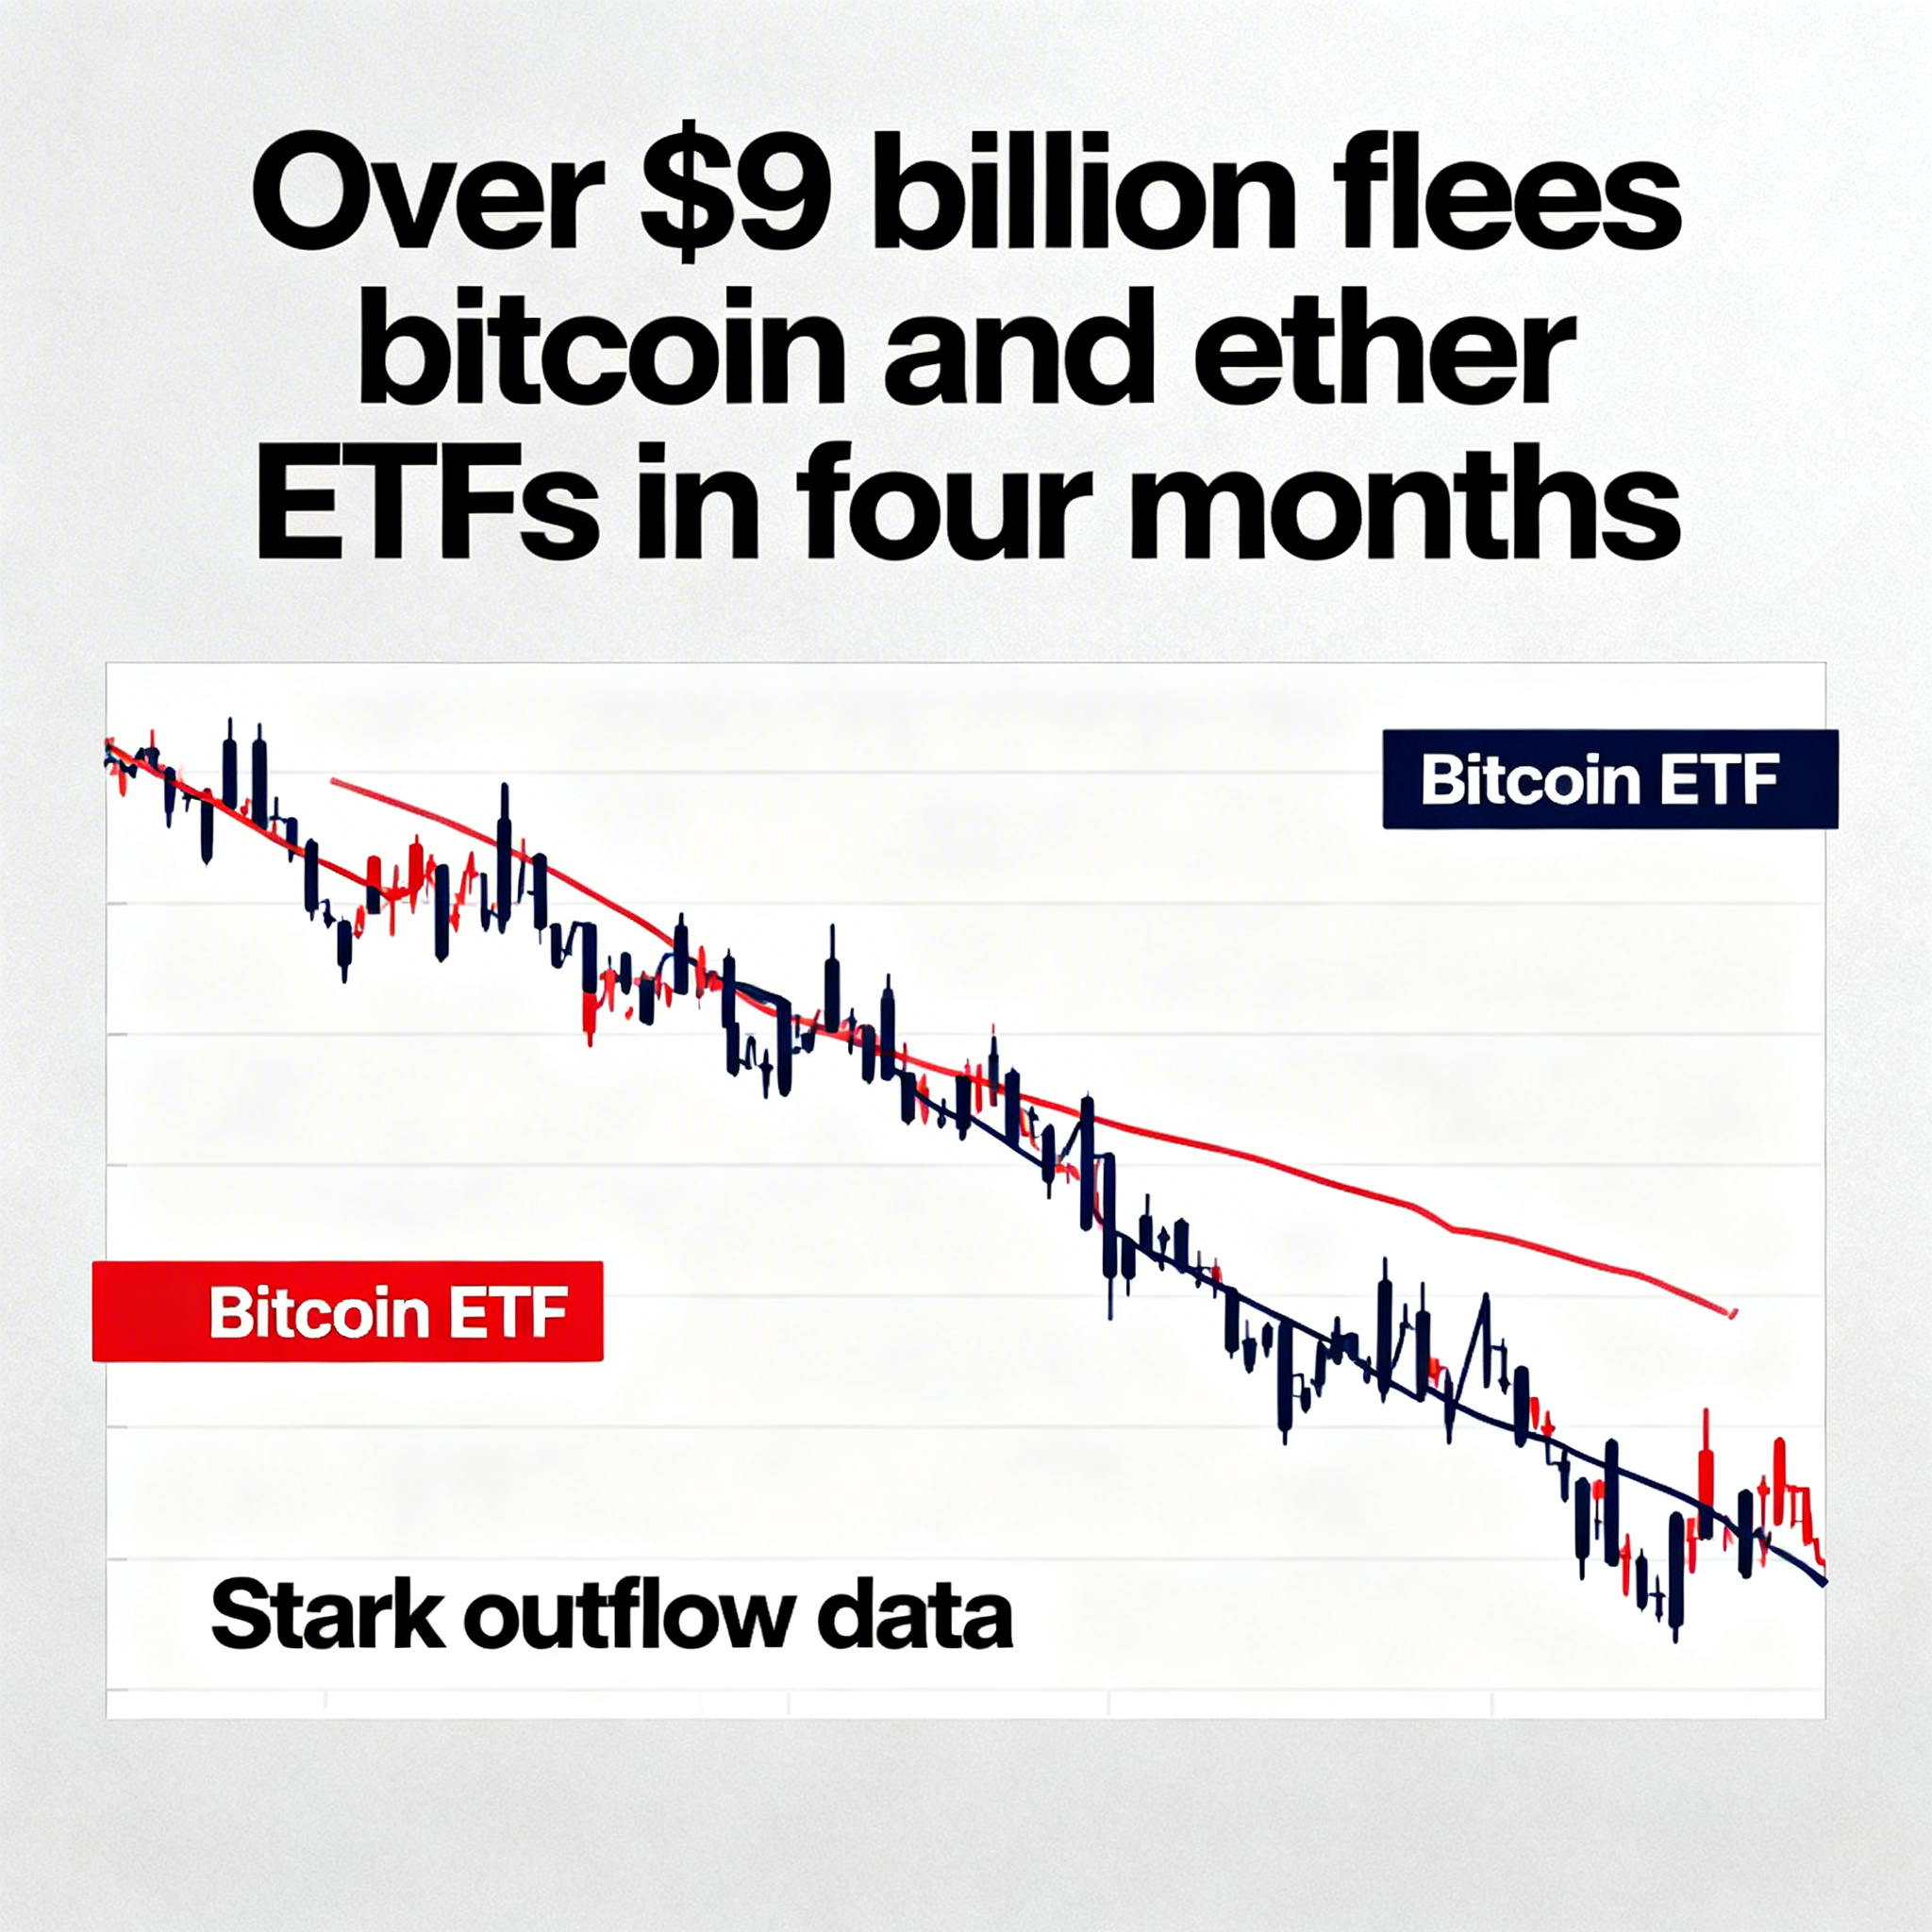
While the technical signals are concerning, the market is structurally different now. Spot Bitcoin ETFs and sustained institutional involvement — including large corporate holdings — have helped mature the asset’s profile. Bitcoin is no longer a fringe play; it’s becoming a macro asset class.
Still, that doesn’t eliminate the risk of overheated markets. Should rumors about a potential Trump-led U.S. Bitcoin reserve materialize, the market could experience a short-term spike — but that kind of speculative rally often ends in sharp corrections.
The Road Ahead: Volatility or Validation?
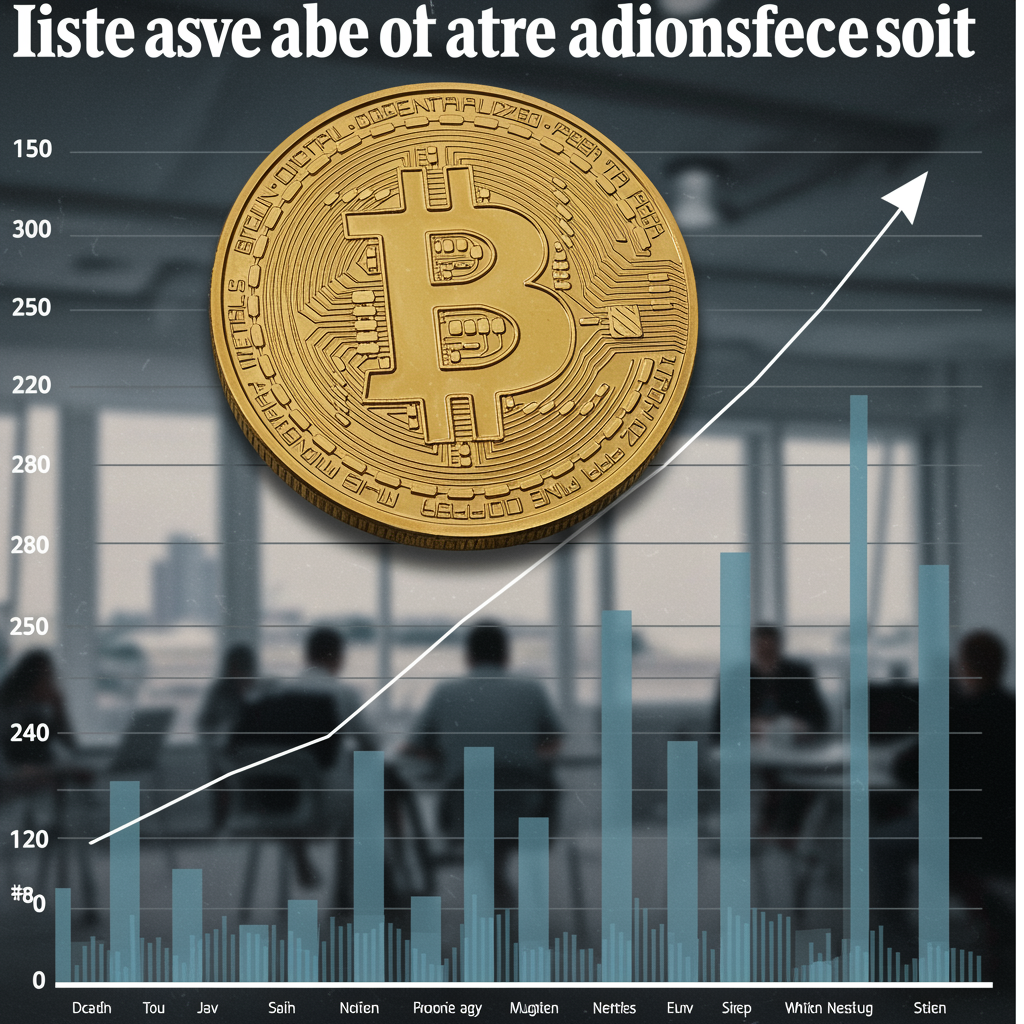
On-chain signals aren’t destiny. Bitcoin has defied bearish data before. But traders and analysts alike are now questioning the strength behind this move. Several are warning that calls for $150,000 or even $200,000 may be premature — especially if history repeats itself and retail euphoria outpaces fundamentals.
Moreover, this cycle introduces new potential fault lines: MicroStrategy’s leveraged position, the rapid rise of Bitcoin-based DeFi with $6.3 billion in TVL, and fragile memecoin ecosystems that are prone to evaporate during downturns.
The coming weeks could reveal whether this is the beginning of Bitcoin’s next leg higher — or a warning shot echoing from the past.