Bitcoin’s calm charts point to potential major price swing
Bitcoin has entered a period of unusually low volatility, suggesting the market may be building toward a sharp move.
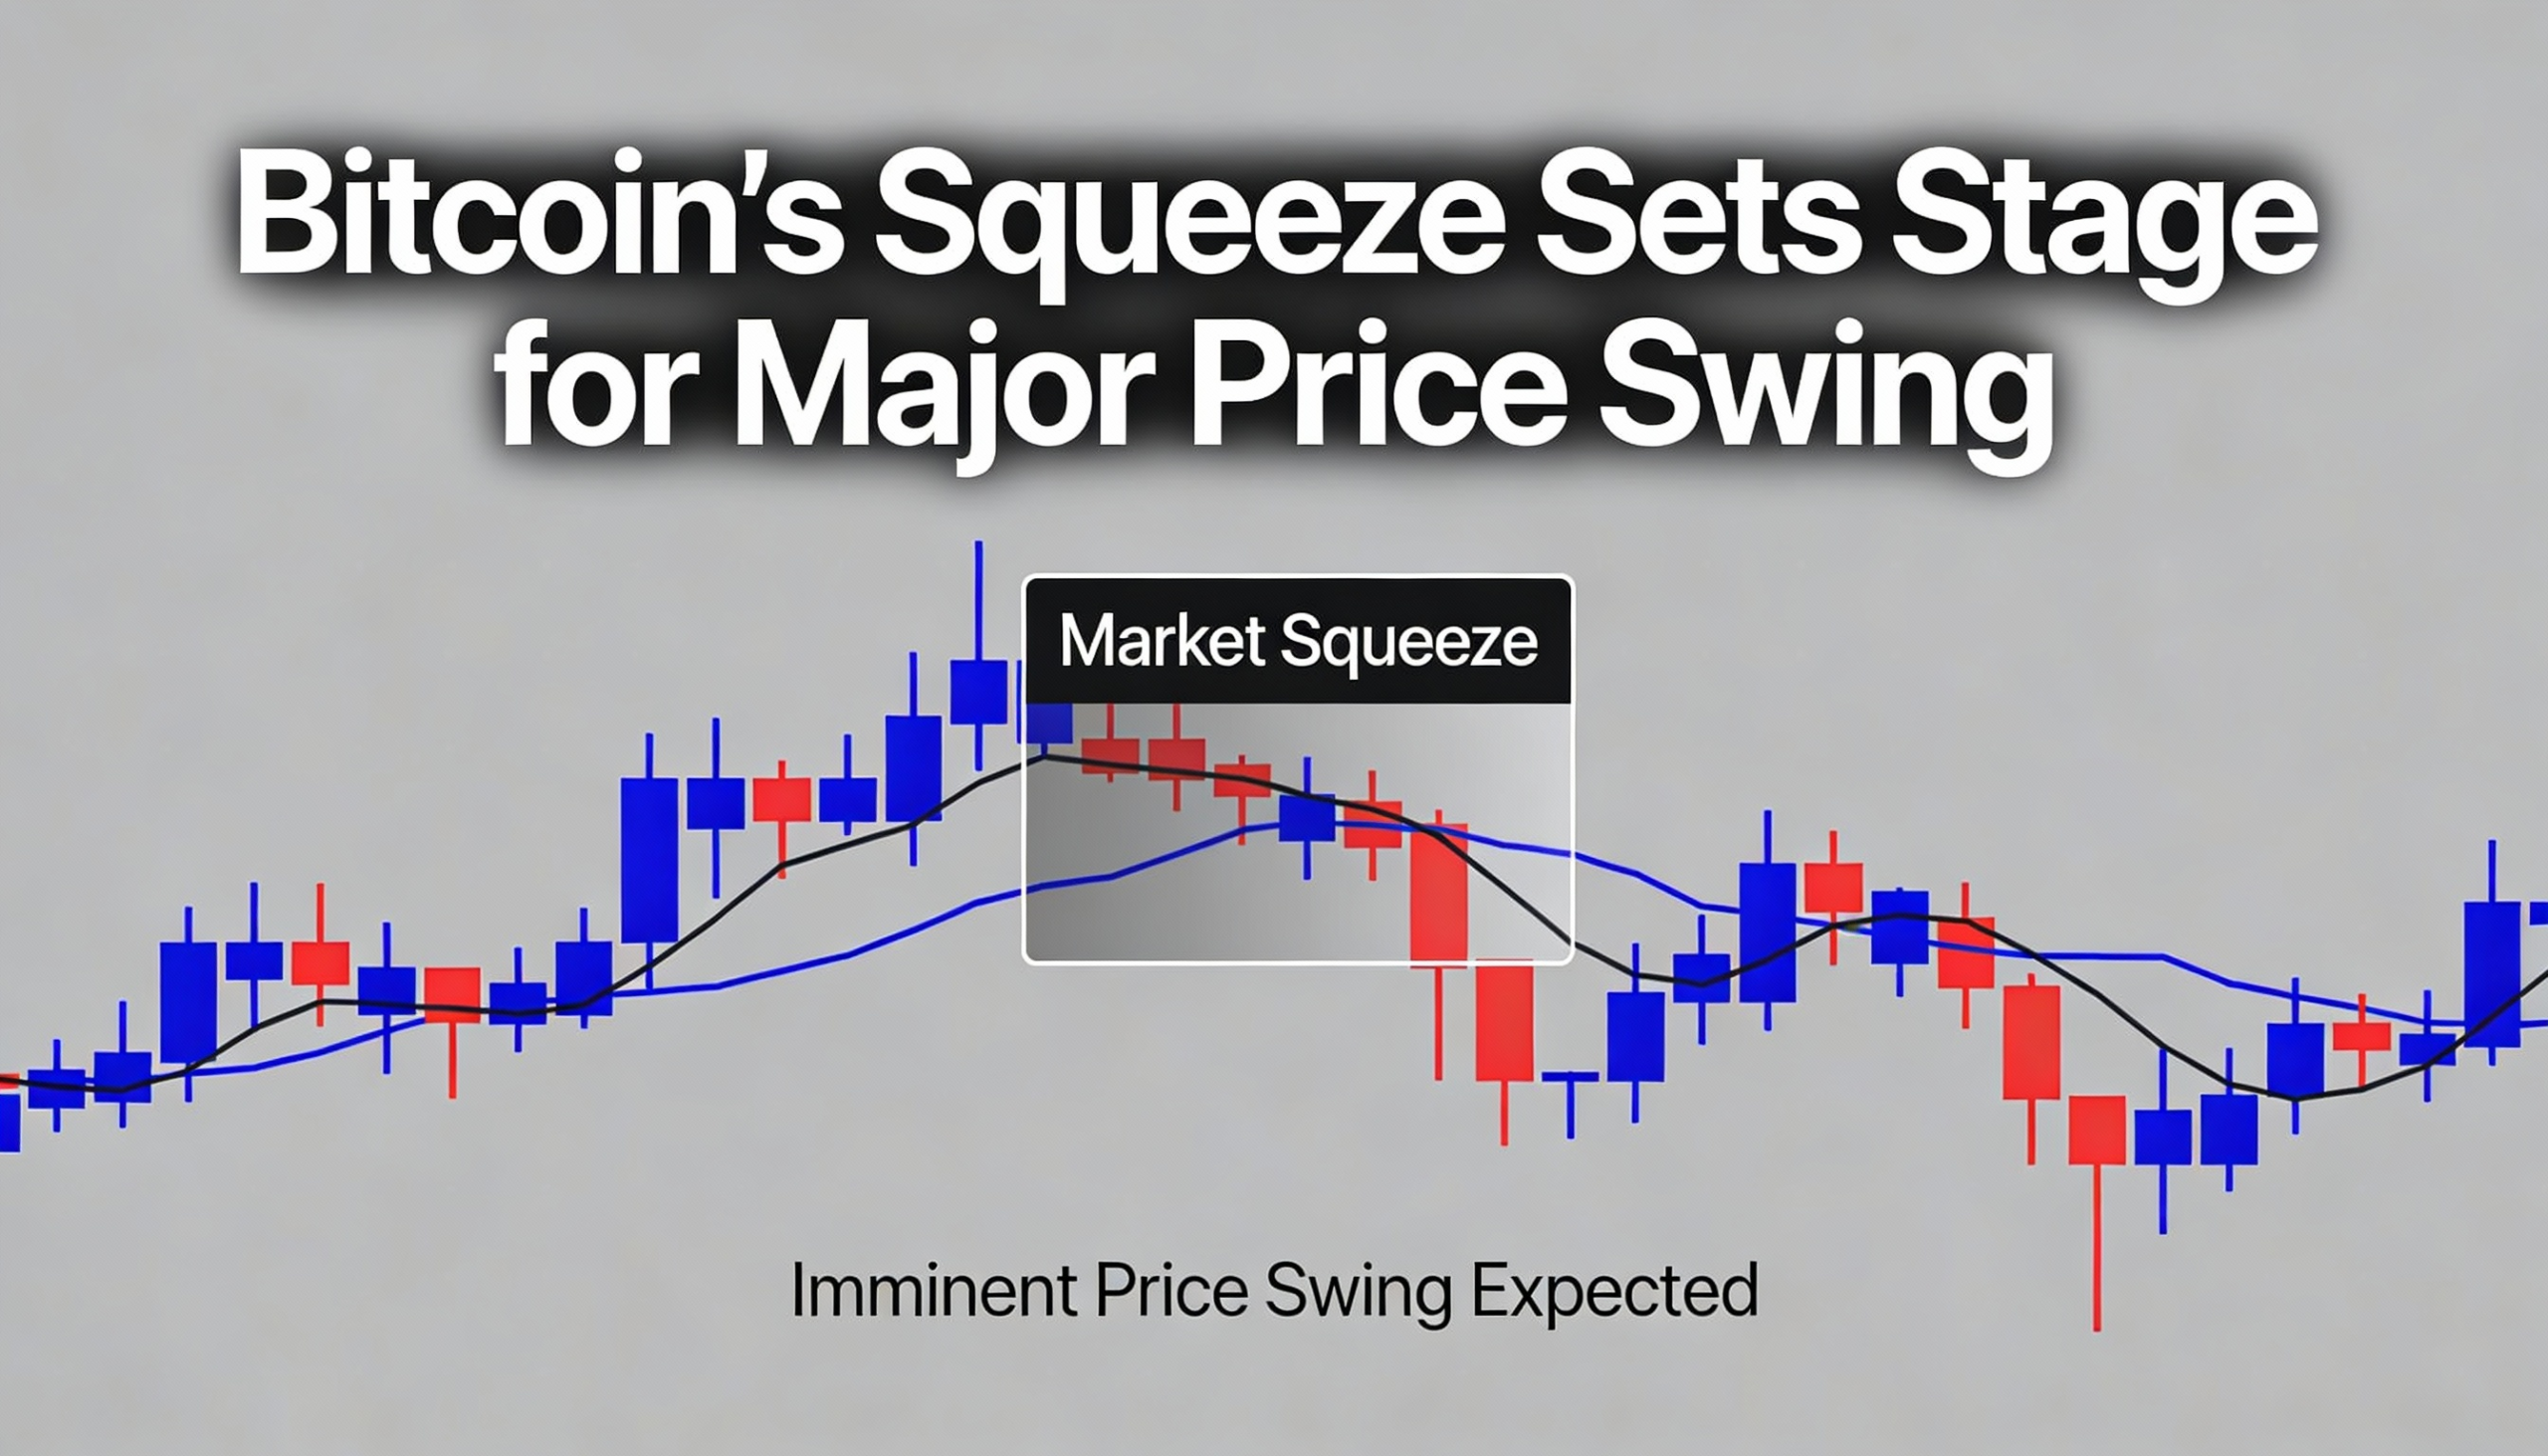
BTC has traded in a tight range between $85,000 and $90,000 over the past two weeks. The distance between its Bollinger Bands — a measure of volatility set two standard deviations above and below the 20-day moving average — has contracted to under $3,500, the narrowest since July, according to TradingView data.
Historically, such “Bollinger Band squeezes” often precede significant price swings. In late July, a two-week consolidation near $115,000–$120,000 preceded a surge to $126,000. A similar pattern in February foreshadowed a drop from $94,000–$98,000 down to $80,000.
Since 2018, these squeezes have reliably signaled periods of heightened market volatility.
Traders should remain alert: BTC could break sharply in either direction. At the time of writing, bitcoin traded around $88,600, up just over 1% on the day.