The real question is whether this selling pressure starts to turn into a meaningful reversal signal—or whether it simply continues to overwhelm any early signs of stabilization.
Discover: The Best Crypto to Diversify Your Portfolio
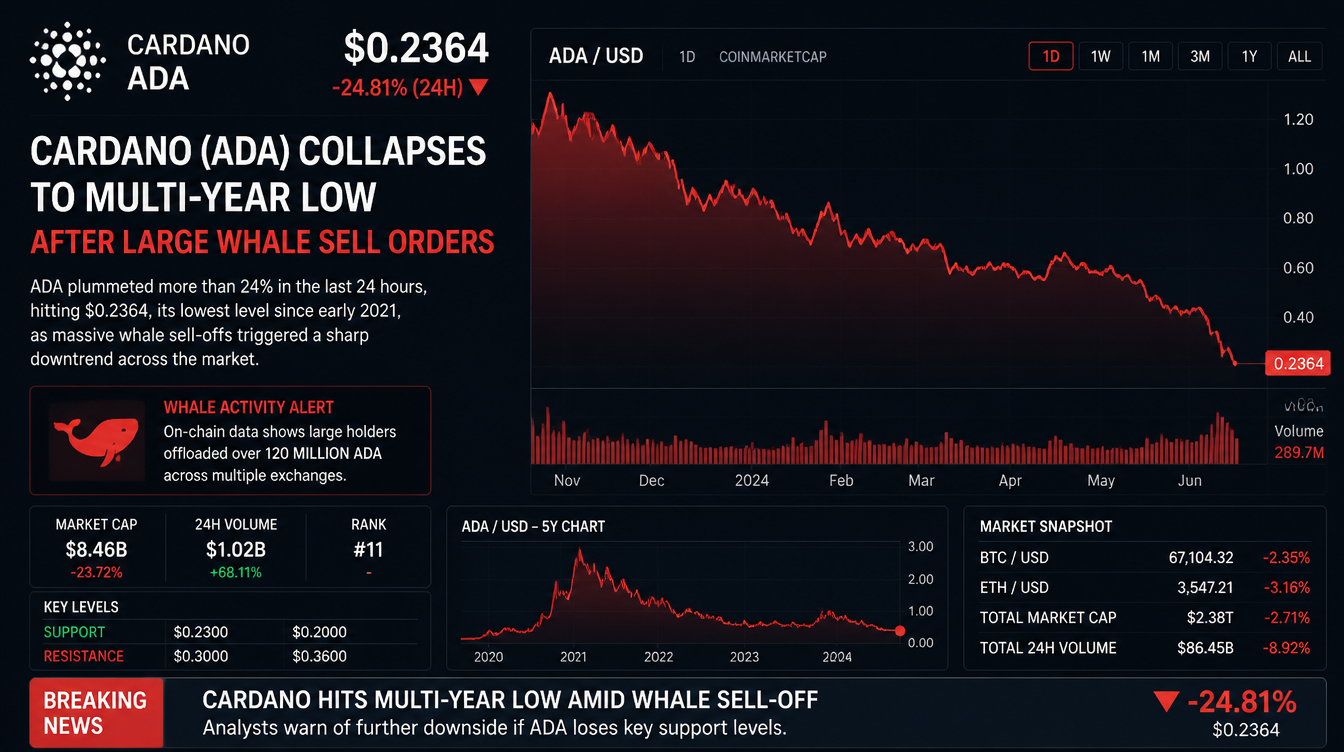
Cardano News: What Whale Activity and On-Chain Data Reveal
Data from Santiment highlights a sharp rise in Cardano’s Age Consumed metric alongside a flattening of Mean Dollar Invested Age as ADA dropped toward $0.1485. Together, these signals suggest that long-dormant holders may have begun moving coins again, often a sign of capitulation or broad redistribution rather than normal trading activity.
Whale behavior adds further weight to the bearish picture. Wallets in the 10–100 million ADA range have reportedly sold around 180 million tokens within days, while the 1–10 million cohort previously reduced holdings by more than 560 million ADA over a four-day period.
This wave of distribution is also taking place against a broader market backdrop of weakness. ETF outflows, institutional de-risking, and macro-driven risk aversion have pressured the wider altcoin market, meaning Cardano’s decline is part of a larger trend rather than an isolated move.
From a technical standpoint, the 50-, 100-, and 200-day EMAs are tightly clustered between $0.23 and $0.33—well above current prices. This alignment typically reflects a structurally broken uptrend rather than a routine correction.
Cardano Price Prediction: Where ADA Could Be Headed
Over the past two years, Cardano has experienced a full boom-and-bust cycle on the weekly timeframe. After trading in a relatively stable range between $0.35 and $0.50 through mid-2024, ADA surged in late 2024, peaking near $1.35–$1.40 in early 2025.
That rally was followed by increasing volatility and a series of lower highs throughout 2025. Since mid-year, ADA has been locked in a sustained downtrend, giving back most of its gains and recently falling to fresh lows around $0.1666. As of June 11, 2026, ADA trades near $0.1666, showing only a modest weekly gain while remaining near the bottom of a long descending channel.
Momentum indicators continue to reflect weakness, with the RSI (14) sitting at approximately 27.83—deep in oversold territory. While this may point to short-term exhaustion and the possibility of a relief bounce or consolidation, the broader trend remains firmly bearish. Overall, price action has now returned to levels last seen during prior bear market phases, highlighting the scale of the retracement from 2025 highs.