MicroStrategy’s Price Chart Shows Bullish Double Bottom Formation
On March 18, 2025, a bullish technical pattern is unfolding on the price chart of MicroStrategy (MSTR), offering a stark contrast to the bearish warning seen earlier in Bitcoin’s (BTC) price action.
The emerging pattern, a double bottom, consists of two distinct price troughs that form at nearly the same level, signaling that the downtrend may be losing momentum. A trendline, or neckline, connects the peak between the two troughs, and a breakout above this line typically signals a trend reversal from bearish to bullish.
For MicroStrategy, this double bottom formation follows a significant price drop, with the gap between the troughs and the neckline exceeding 35%, much higher than the typical 10% seen in similar patterns. The double bottom pattern has been forming around the $230 level since late February, with resistance at the neckline identified at $320.94, observed during a recovery in early March.
If MSTR’s price successfully breaks above this neckline, it would confirm the breakout and potentially mark the beginning of a new bullish trend. Analysts often estimate the potential upside by adding the distance between the troughs and the neckline to the breakout point, suggesting a price target of $410 for MSTR.
The stock has already broken through the downtrend line that defined its decline from the November high of $543, adding to the evidence of a potential reversal.
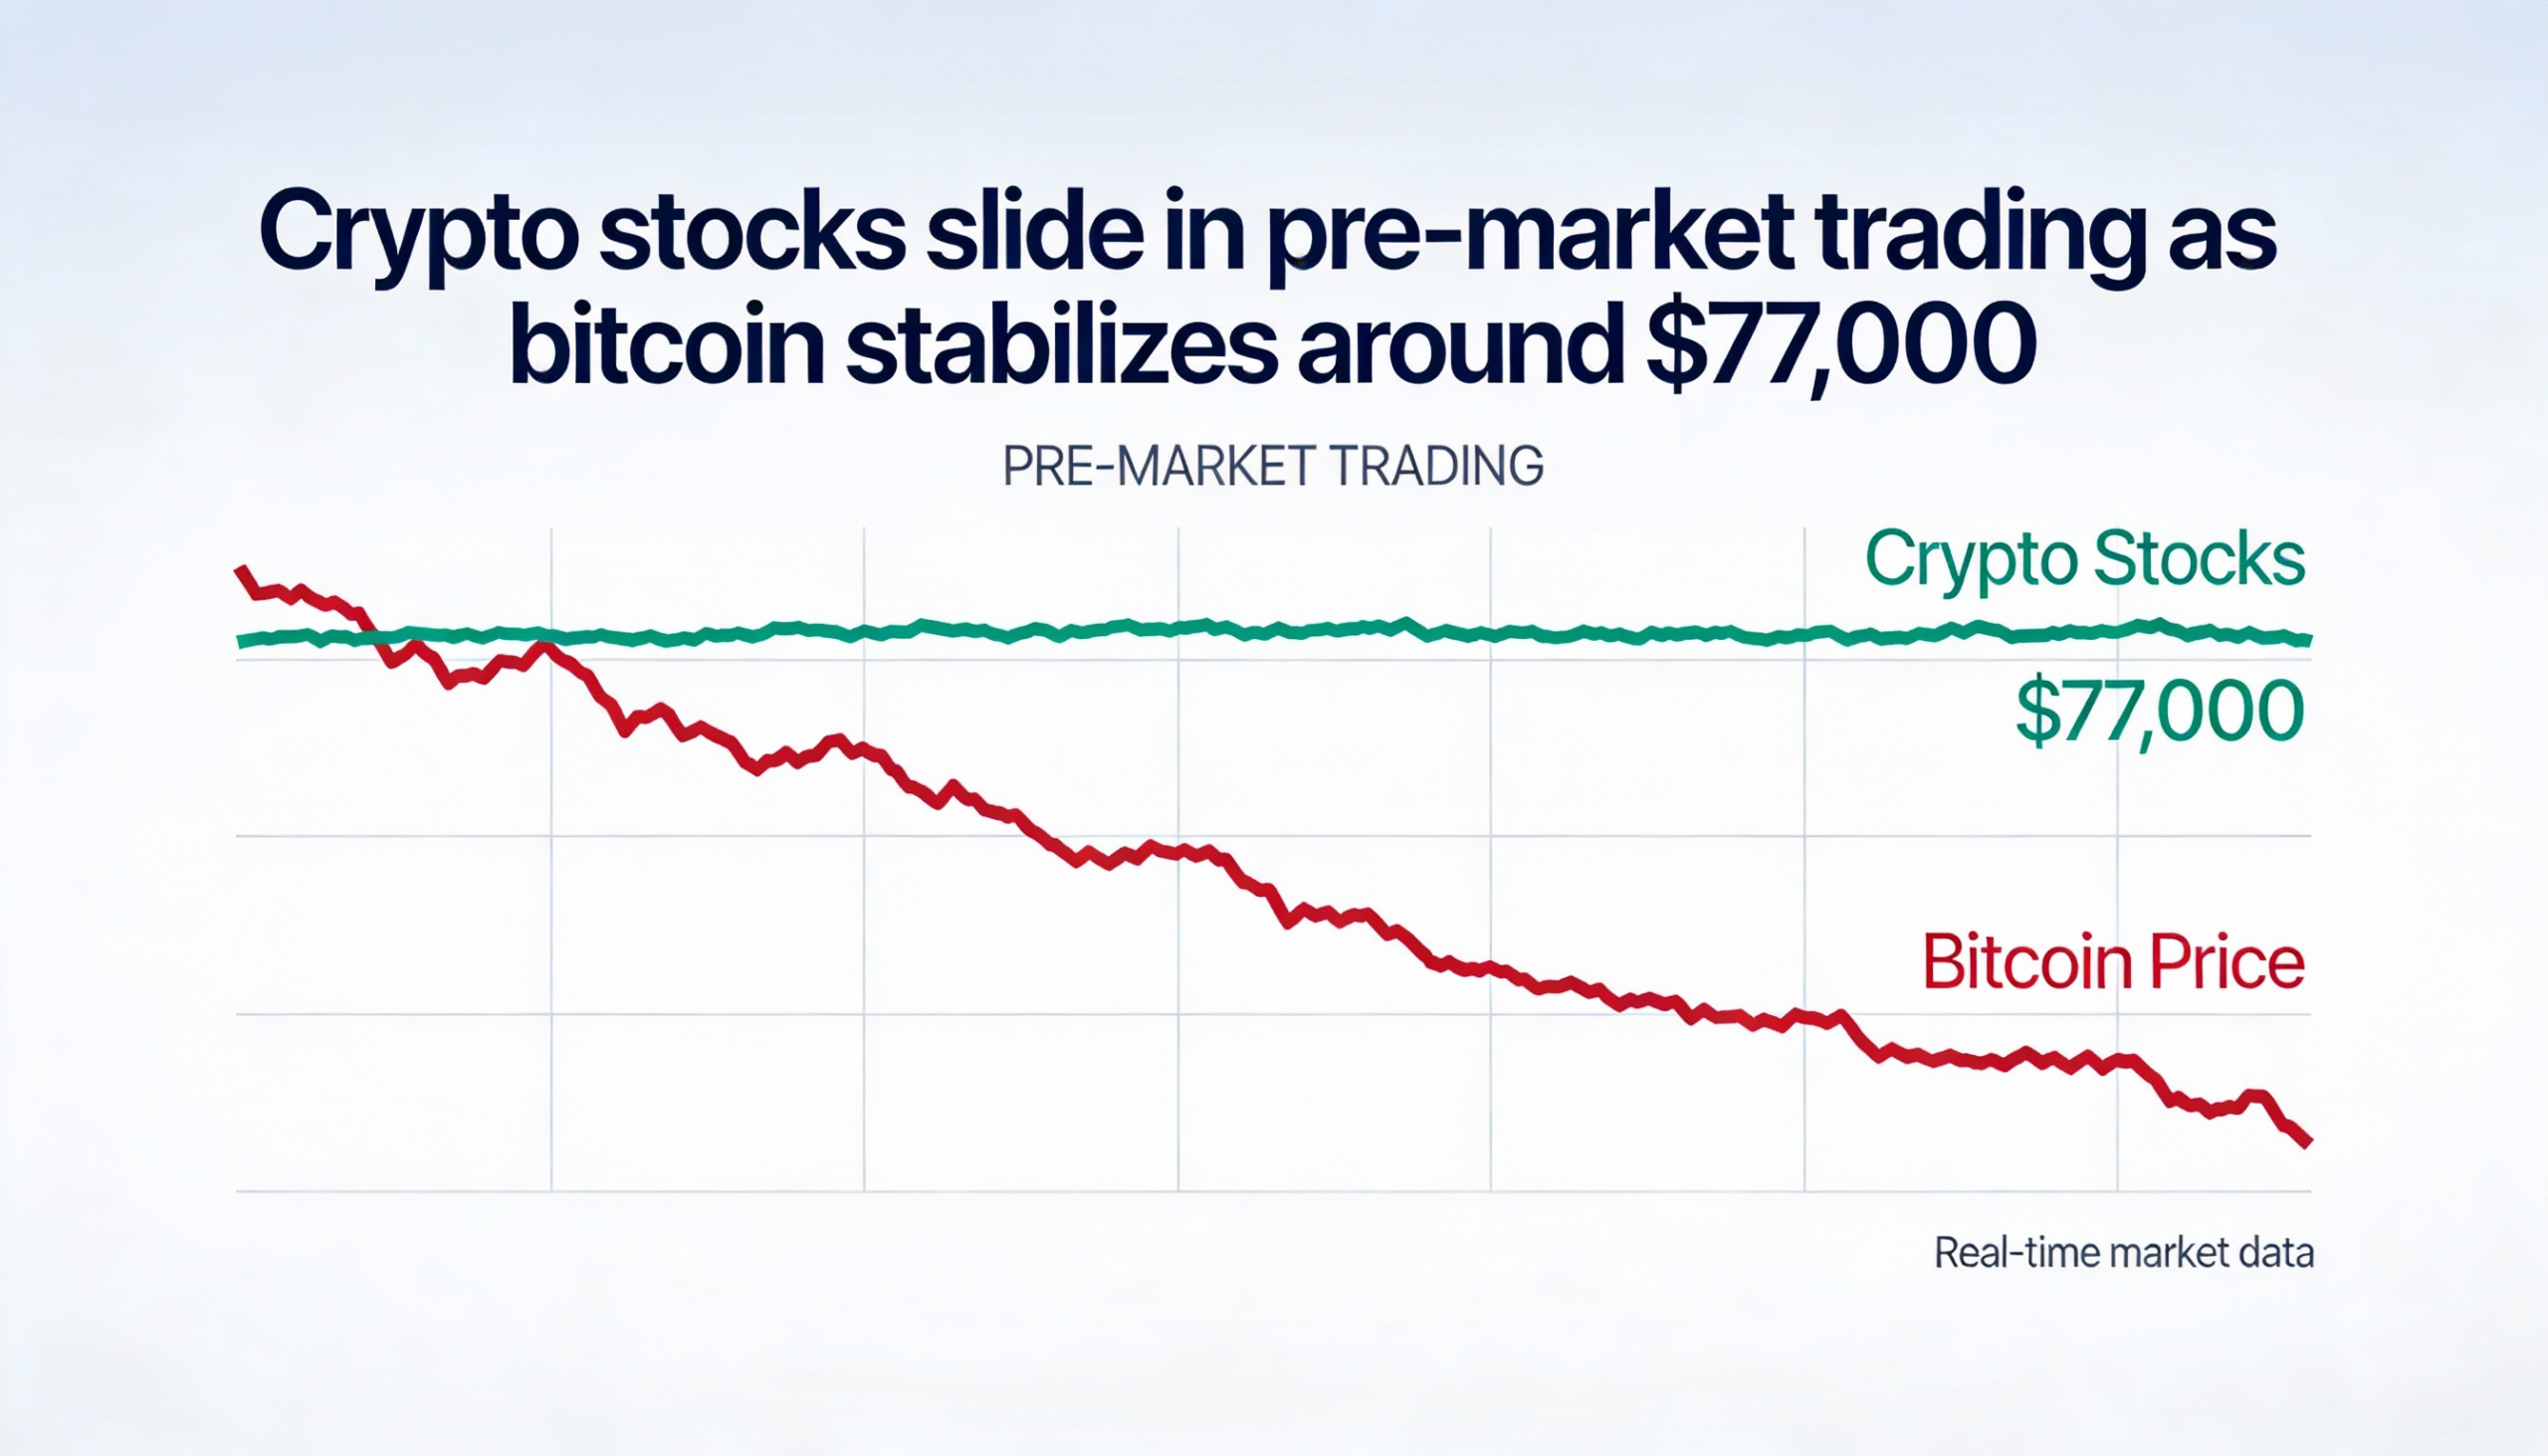
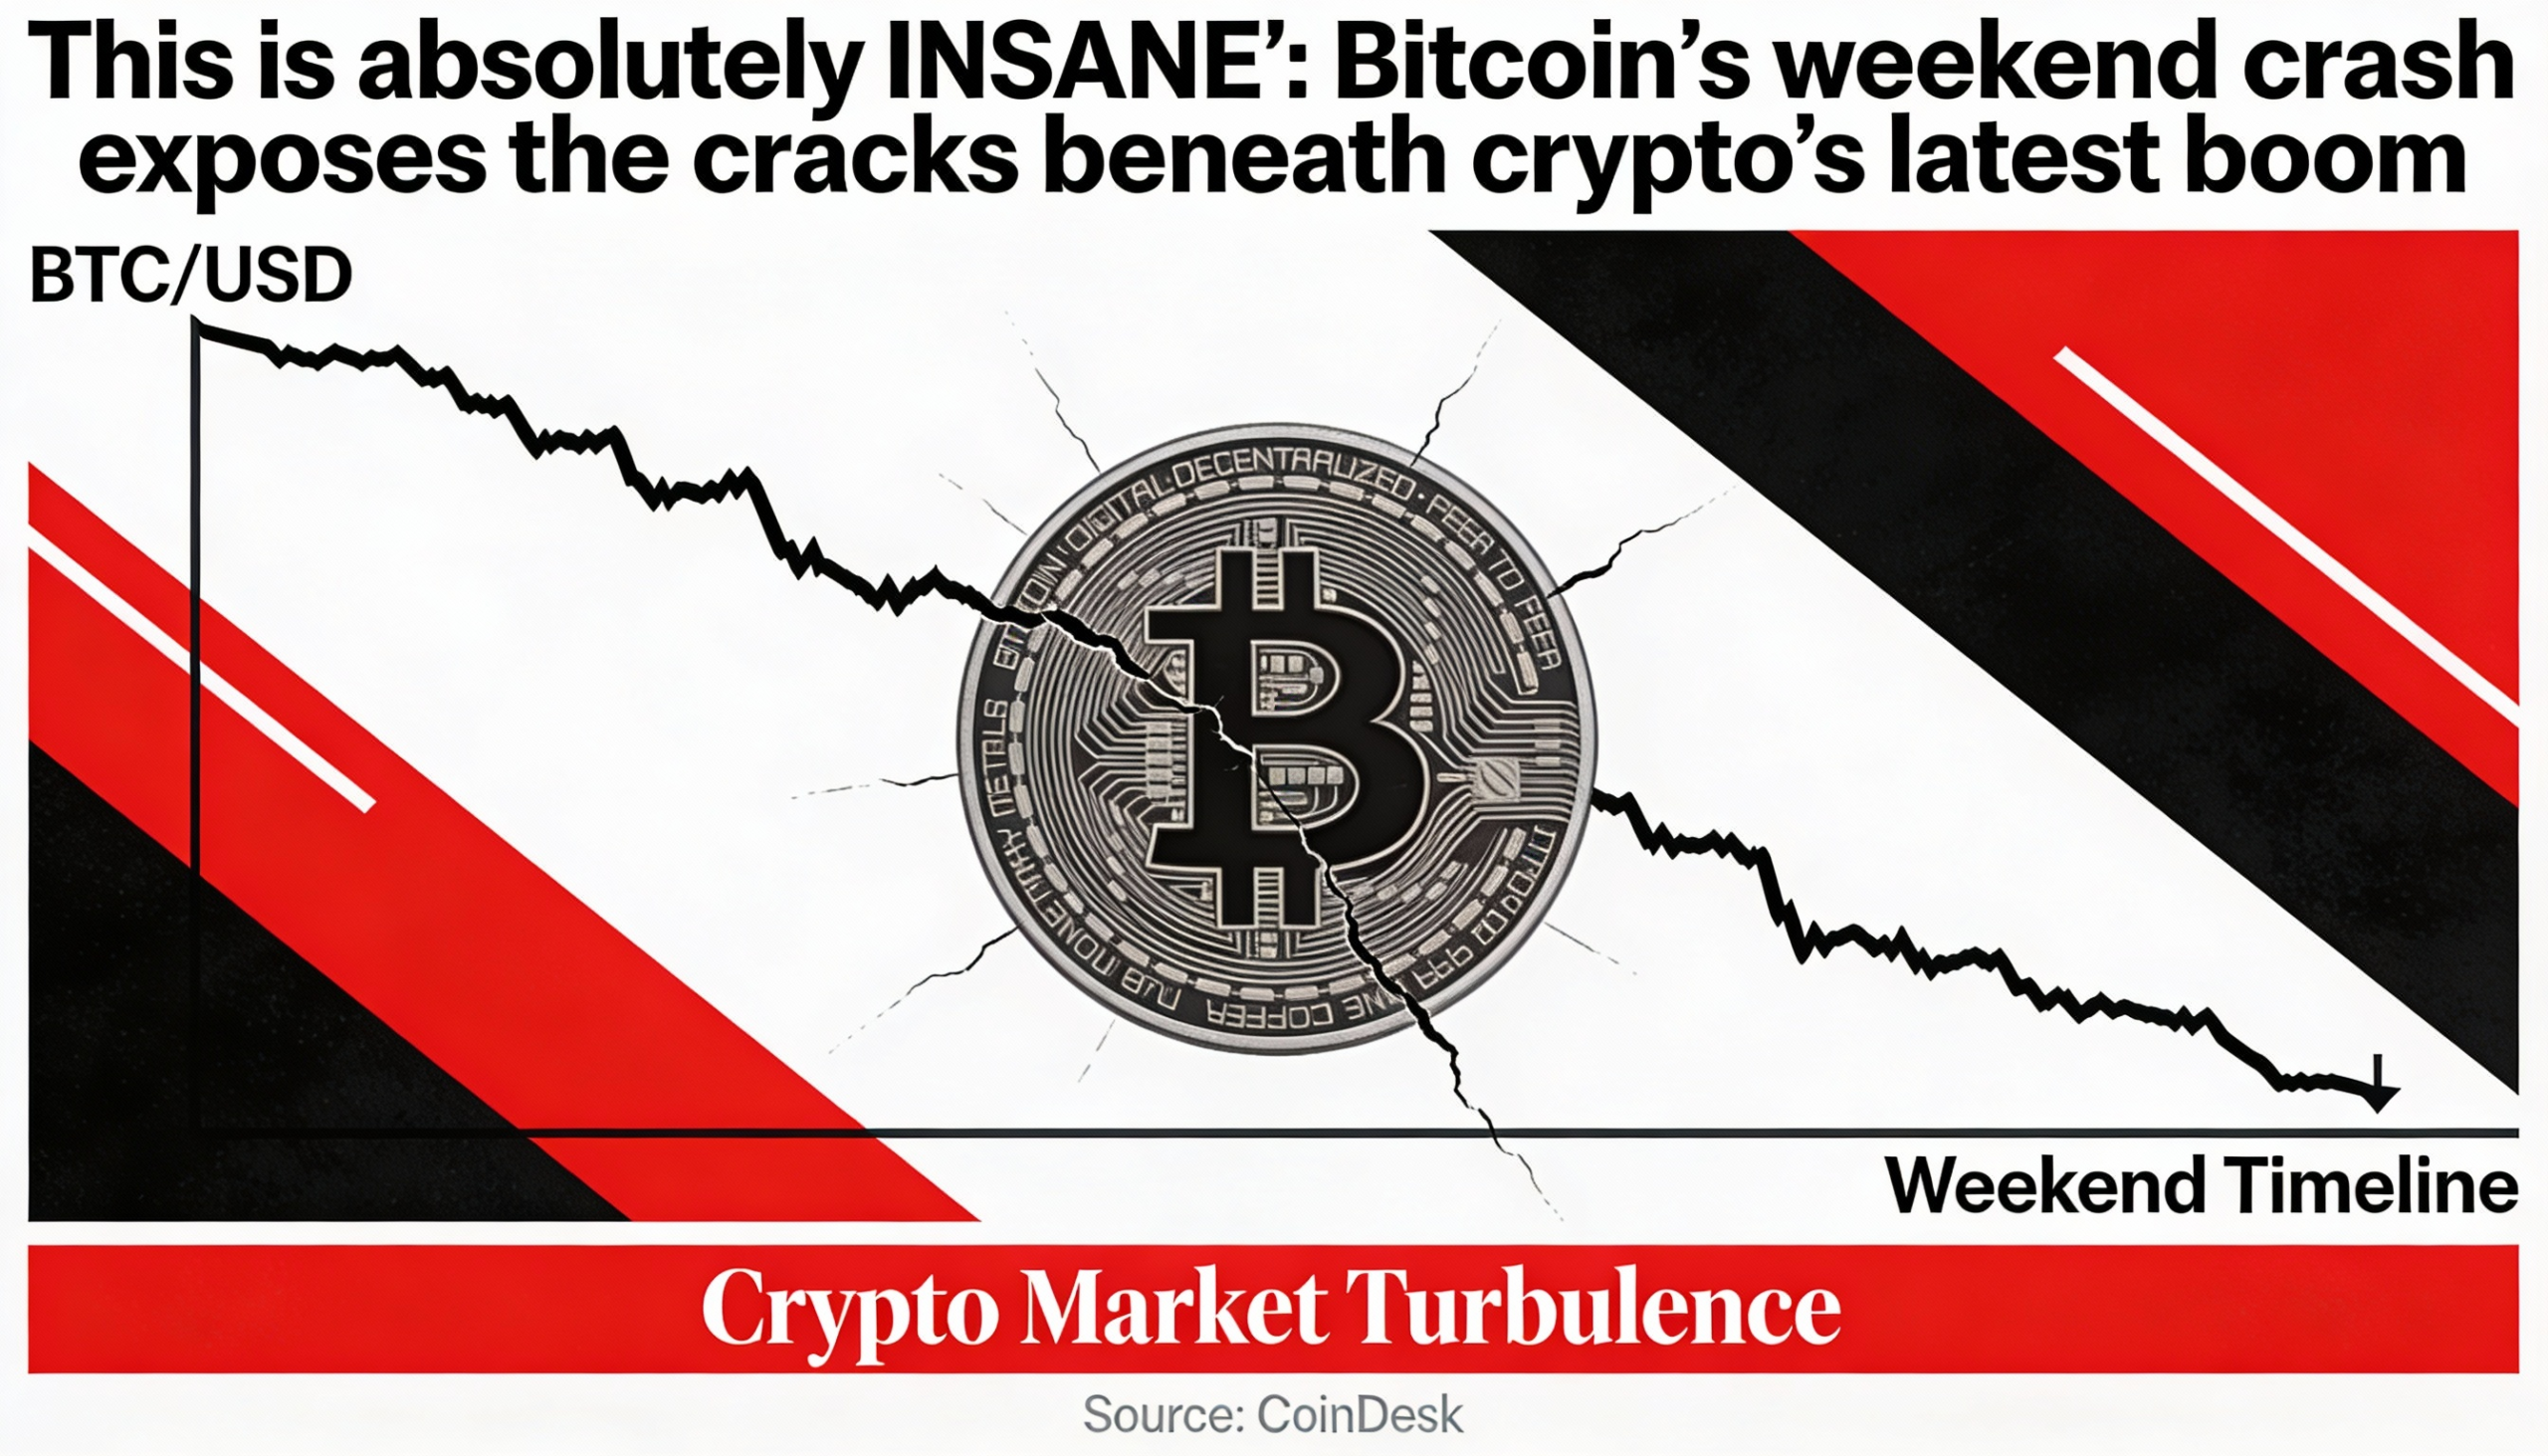
The developing double bottom on MicroStrategy’s chart is a mirror image of Bitcoin’s double top pattern, which warned of a price sell-off earlier this year. Bitcoin’s double top breakdown on February 24 led to a drop below $91,000, with prices continuing to slide to as low as $76,800 last week. A similar pattern was observed in the Nasdaq index at the start of March.
Double bottom and double top patterns are considered highly reliable in technical analysis, with breakouts and breakdowns typically leading to sustained price movements in the direction of the reversal.
As the largest publicly traded holder of Bitcoin, with 499,096 BTC valued at approximately $41.5 billion, MicroStrategy’s price movements are closely watched by market participants, both in the stock market and the cryptocurrency space.