Bitcoin Stalls Below Key Resistance as Bearish Momentum Builds; XRP and Ether Struggle, Solana Eyes Golden Cross
Bitcoin’s months-long uptrend is showing signs of exhaustion, as multiple technical indicators flash warning signals across both weekly and daily timeframes.
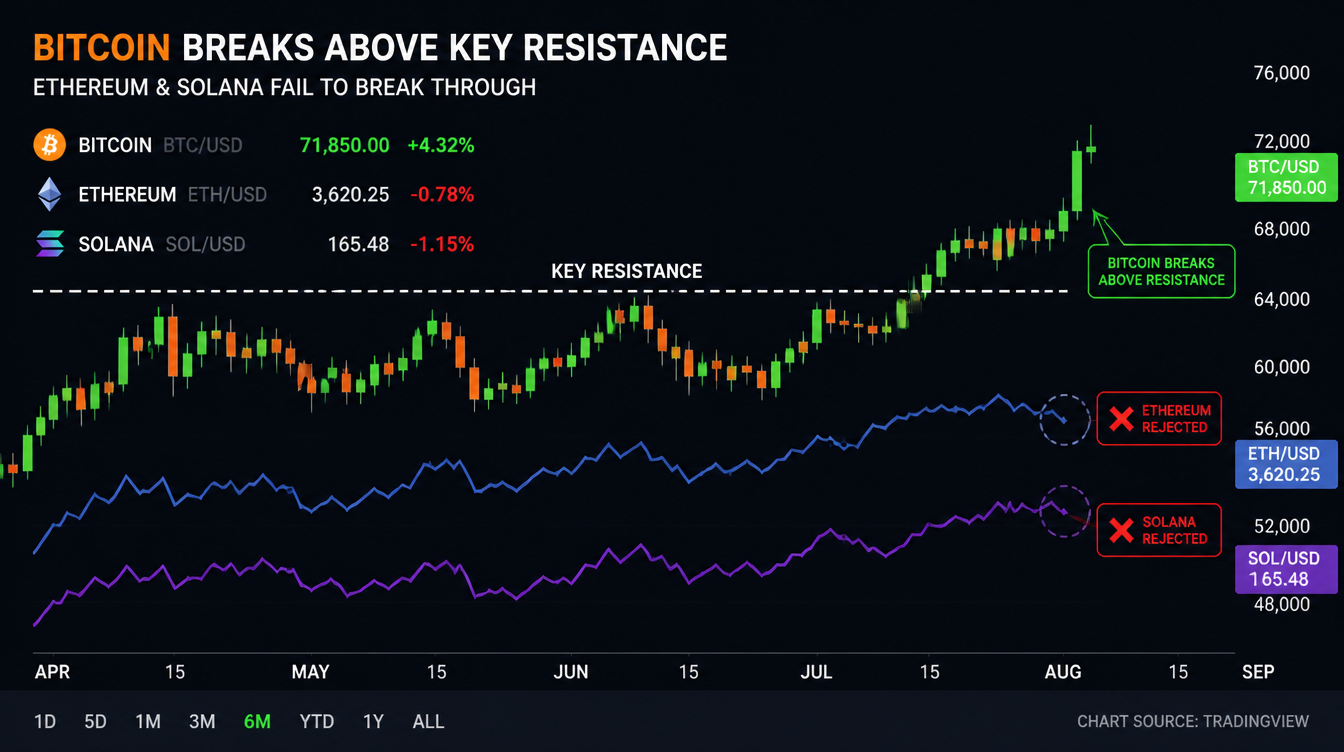
Bitcoin: Momentum Fades Below Macro Resistance
Bitcoin (BTC) has failed to break convincingly above the long-term trendline that connects the 2017 and 2021 cycle highs, raising red flags for bullish momentum. On the weekly chart, the MACD histogram remains positive but has declined meaningfully since its peak in December 2024 — the last time BTC tested this same trendline.
Adding to the caution, the 14-week RSI has broken below its upward sloping trendline from the March lows and continues to post lower highs, signaling a loss in upward strength.
Shorter-term signals are no more encouraging. The daily three-line break chart — which filters out noise to focus on trend shifts — has now printed three consecutive red bars, a classic reversal signal that indicates sellers are in control.
This combination of a failed macro breakout, softening momentum, and trend-confirming reversals suggests the next move could be lower, potentially testing support around $111,965, with an eye on $100,000 as the next key level. Bulls must reclaim $122,056 to negate the bearish setup.
- Resistance: $120,000, $122,056, $123,181
- Support: $111,965, $112,301 (50-day SMA), $100,000
XRP: Struggling to Break the Downtrend
XRP is attempting to breach its corrective downtrend line but faces significant headwinds. While the price has bounced slightly, it’s currently capped by the 38.2% Fibonacci retracement level, which continues to act as firm resistance.
Bearish pressure remains intact across timeframes. Both the 5- and 10-day SMAs are sloping downward, while on the hourly chart, the 50-, 100-, and 200-SMAs are also aligned in a bearish configuration — a textbook signal of a well-established downtrend.
A daily close above $3.00 would open the door to retest the recent lower high at $3.33, but without a confirmed breakout, the bias remains downward.
- Resistance: $3.33, $3.65, $4.00
- Support: $2.72, $2.65, $2.58
Ether: Bearish Outside Week Confirms Downside Risk
Ether (ETH) dropped nearly 10% last week, forming a bearish outside week candle — a strong reversal pattern that suggests a shift in control back to the bears.
The daily chart supports this view, with a bearish crossover between the 5- and 10-day SMAs confirming a breakdown in short-term bullish momentum. The three-line break chart also shows two consecutive red bars, underscoring the shift in trend.
While ETH has managed a modest rebound in early August, indicators continue to suggest weakness. Unless bulls reclaim control soon, downside targets near $3,000 could come into play.
- Resistance: $3,941, $4,000, $4,100
- Support: $3,355, $3,000, $2,879
Solana: Bulls Defend Key Fib Level Amid Golden Cross Setup
Solana (SOL) has held above the 61.8% Fibonacci retracement of its recent rally — a level often seen as a key inflection point in bullish structures. This support defense has halted the token’s decline for now.
Meanwhile, a major technical milestone is approaching: the 50-day and 200-day SMAs are close to forming a golden cross. While lagging by nature, this pattern often confirms a shift toward long-term bullish momentum and could spark renewed buying interest.
Still, short-term risks remain, as both the 5- and 10-day SMAs continue to slope downward. For now, Solana’s bulls must protect the Fib level to pave the way for upside continuation.
- Resistance: $175, $187, $200
- Support: $156, $145, $126